

Image Source: Pixabay
October came to a close, and while investors had braced for volatility throughout the month, they got off relatively easy.
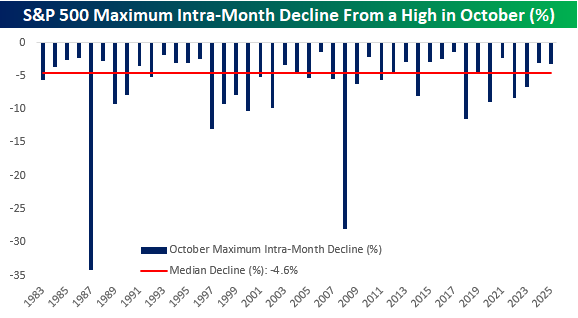
From its MTD high (at the time) on Oct. 9 to its intraday low on the following day, the S&P 500’s maximum drawdown from a high was 3.16%. While last October’s maximum drawdown of 2.99% was smaller, this past month’s max decline was 1.44 percentage points less than the median maximum drawdown of 4.60% seen during the month dating back to 1983, which is as far back as we have intraday price history for the S&P 500.
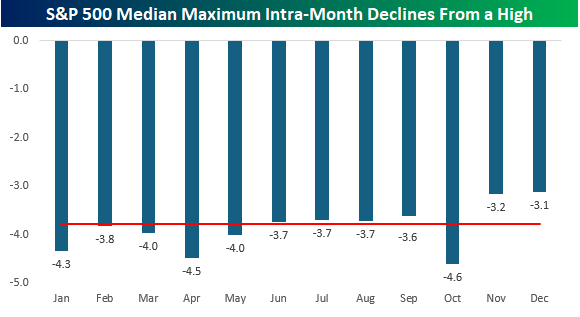
October is often known as the most volatile month, and history backs that up. As shown in the chart below, no other month has experienced a larger median maximum drawdown. Somewhat surprisingly, though, April at -4.5% and January at -4.3% aren’t far behind.
What makes the month seem even more volatile than it is, though, is that for anyone who has been around a while, two of the three largest intra-month drawdowns from a high have both occurred in October. In 1987, the S&P 500 declined by more than 34% from peak to trough, while in 2008, it plunged by 28%.
The only other months with an intra-month decline of more than 25% were March 2020 (-30.12%) when Covid shut down the economy and November 2008 (-26.45%) during the Financial Crisis. It isn’t always a crazy month, but when it is, October sure knows how to disappoint.
More By This Author:
Anticipation BuildsStrong Run Of Earnings Continues
Small Business Hesitation


Comments
Log in or sign up to join the conversation.