

Image Source: Unsplash
The next few weeks, and this one in particular, offer the potential for some market moving volatility. As has become typical, the markets either don’t perceive it, or more likely, don’t care. With the prospect of a government shutdown looming and a key employment report due on Friday, not to mention earning season later this month, one might expect VIX (Cboe Volatility Index) to have something above a 15 handle. As usual though, there are some subtleties underneath that headline statistic.
Note – Just before I sent this to be published, a headline stated that if the government was under a shutdown, the BLS would not be releasing jobs data on Friday.That could cloud the analysis below, which was written when there was some debate about the topic.
It is important to once again remember a few things about VIX specifically, and volatility measures overall.If we combine the following two concepts, we find a reasonable explanation for the seeming paradox.
First, VIX is not constructed as a fear gauge, but instead is designed to measure expected volatility over the coming 30 days.All things being equal, the lower the level of VIX, the lower the expectations for volatility.All things of course are never equal, but traders typical project that periods of low volatility persist in spite of the potential for items to disrupt the calm.
Second, a key determinant of index volatility is the amount of correlation between an index’s components.If correlations are high, then so is the index’ volatility, relatively speaking; if correlations are low, so is the index’ volatility.As the Cboe’s Mandy Xu described it to me in an IBKR Podcast:
… take it to the extreme and simplify it to an index of just two stocks equally weighted.If one stock goes up 20% in a day and another stock goes down 20% in a day, at the index level that’s unchanged. So, high stock volatility, but very low index volatility in an environment of extreme dispersion or low correlation.
As we have done before, we turn to the relationship between the COR1M index and VIX for some clues.The Cboe created a set of implied correlation indices with different time frames.We prefer the 1-month time frame of COR1M, as opposed to COR3M’s 3-months, and the like, because the 1-month time frame matches that of VIX. The exchange describes the indices this way:
Implied Correlation, a gauge of herd behavior, is the market’s expectation of future diversification benefits. It measures the average expected correlation between the top 50 stocks in the SPX index. Cboe calculates COR3M by using ATM delta relative constant maturity SPX index and component option implied volatilities.
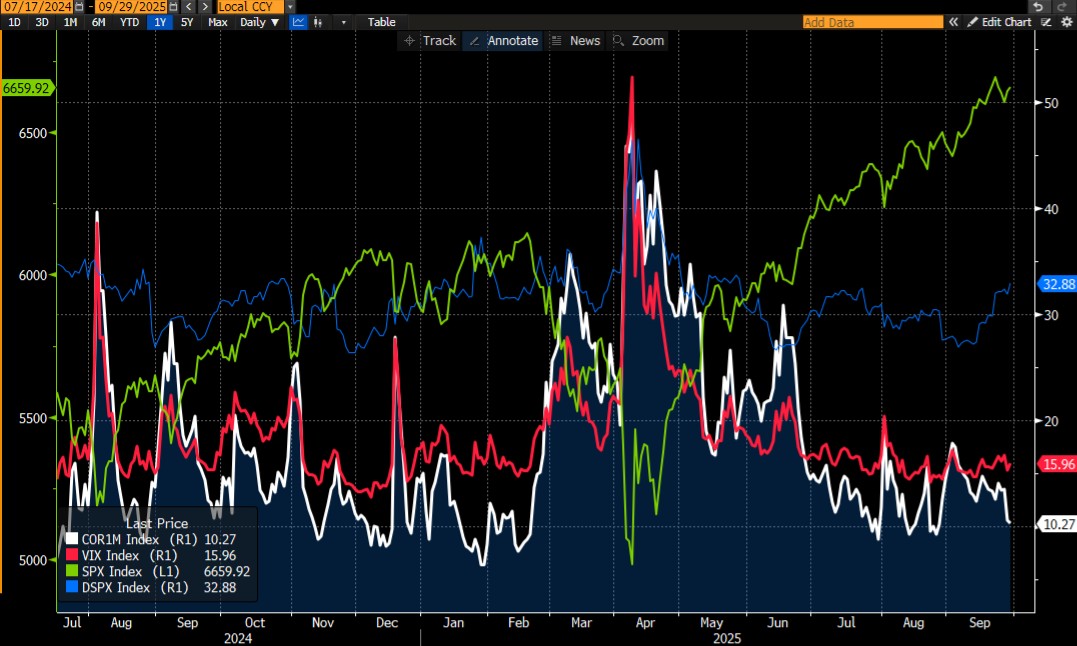
Considering that the top 50 stocks in the S&P 500 (SPX) make up the majority of the parent index’ weight, the simplified methodology should not materially impact the value of the correlation indices.Instead, we find that VIX and COR1M generally parallel each other.Yet there are times, such as now, when VIX fails to follow COR1M lower.As we can see in the chart below, drops in SPX are often presaged by just such events.
Since July 17, 2024: COR1M (white), VIX (red), SPX (green), DSPX (blue)
(Click on image to enlarge)
Source: Bloomberg
We can see that once again, VIX remains stubbornly above the dropping COR1M level.While not every occurrence over the prior year-plus has led to a significant drop – we’ve had precious few of those – each drop of any consequence was preceded by this situation.That tells us that traders are loath to abandon their willingness to hedge the potential for future volatility, even if correlations drop.
You may have noticed that we included DSPX[i] on the chart above.This is the Cboe S&P 500 Dispersion Index, which has relevance to the analysis.Dispersion and correlation can be thought of as the inverse of each other, though the calculations are not identical.We include it here as a confirmation measure, allowing us to see whether a drop in COR1M is confirmed by a rise in DSPX. Currently, it is.Frankly, I prefer to use COR1M vs. VIX rather than DSPX vs. VIX because the former relationship is easier to read on a chart.
Thus, even though it appears that traders are shrugging off the potential for future volatility, they are not.One could certainly argue that they are not putting enough emphasis on the upcoming events, “known unknowns”, that could induce volatility.But they are not oblivious to the potential either.
[i] From the Cboe: The Cboe S&P 500 Dispersion Index (DSPX℠) measures the expected dispersion in the S&P 500® over the next 30 calendar days, as calculated from the prices of S&P 500 index options and the prices of single stock options of selected S&P 500 constituents, using a modified version of the VIX® methodology.
More By This Author:
Sometimes “In-line” Is Just OK
Where Comes The Sun?
Alas, Poor Triple Witching…


Comments
Log in or sign up to join the conversation.