
(Click on image to enlarge)
The second winning week in a row did much of what the first week couldn't. Namely, the key stock indices cleared a few technical hurdles. There are still a few more ahead, but this is a good start to at least a shot at the usual year-end bullishness. This week will be a critical one if that's what's in the cards.
We'll look at what happened and what didn't in a moment. First, let's run through last week's biggest economic reports and preview what's coming this week. Although stocks were bullish for the bulk of the week, the economy is hardly firing on all cylinders.
Economic Data Analysis
It was a pretty busy week last week in terms of news, particularly for real estate and closely-related consumer sentiment.
As was widely expected, home prices fell again... a lot. The S&P Case-Shiller Index is still 13.1% higher than its reading from August of last year, but it's clear that prices are suffering as a result of rising mortgage rates. That's the weakest year-over-year growth in years. The FHFA Housing Price Index slumped as well, sliding 0.7% from July's print. There's no denying this is a red flag.
Home Price Charts
(Click on image to enlarge)

Source: Standard & Poor's, FHFA, TradeStation
Do bear in mind that these figures are a bit stale, being from August. It's unlikely things improved any in the meantime though. If anything they got worse. While we're not charting it here, new home sales for last month fell from a pace of 677,000 to 603,000, and pending home sales fell 10.2% in September. That's the biggest pending sales contraction in years, and one of the weakest new-home sales reports since 2018.
Given this, one would think consumer sentiment would be in the gutter. It isn't though. While it certainly could be better, the Conference Board's consumer confidence figure slipped only slightly from September's score, but is still above pandemic lows. The University of Michigan Sentiment Index is still relatively low as well, but moved higher for a fourth month in a row from the multi-year low reached in June.
Consumer Sentiment Charts
(Click on image to enlarge)
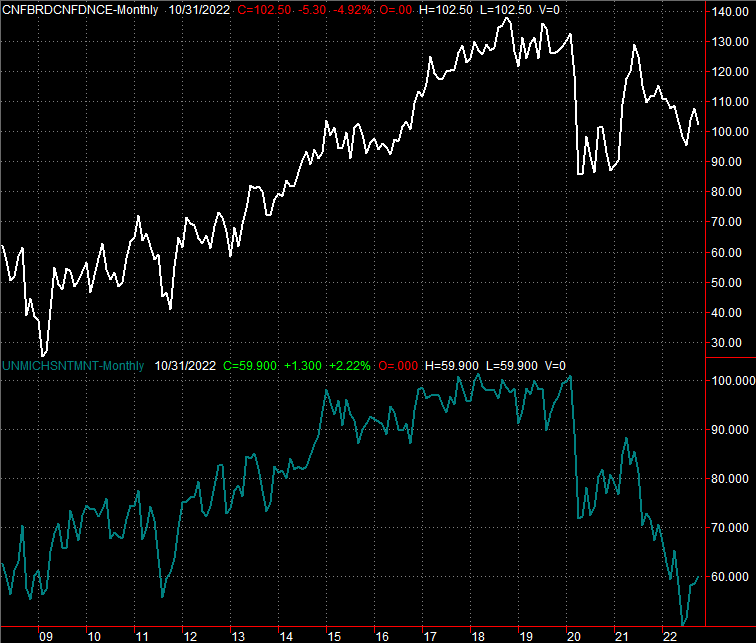
Source: Conference Board, University of Michigan, TradeStation
All things considered, it wouldn't be unfair to describe consumers' confidence as a glass-half-full scenario.
The only other item worth mentioning from last week (and again, we're not charting it) is the first estimate of Q3's GDP growth. While it will be adjusted a couple more times, as it stands right now economic growth rolled in at 2.6% last quarter, ahead of expectations of 2.3%. That's encouraging, but also facilitates more of the inflation that we don't want here.
Everything else is on the grid.
Economic Calendar
(Click on image to enlarge)
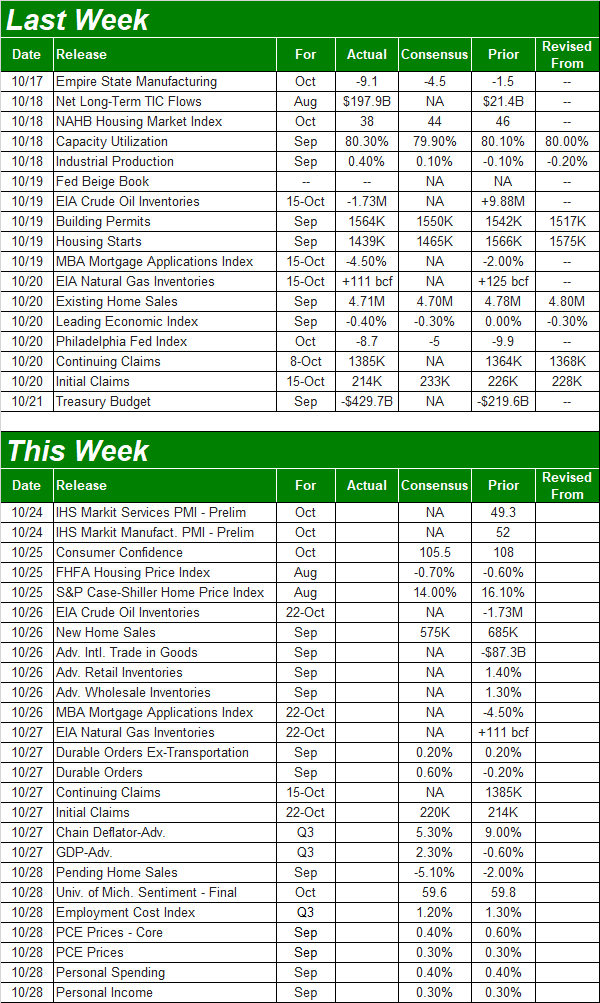
Source: Briefing.com
This week is going to be another raucous one... perhaps even more so. The biggies will be Friday's jobs report for October, and Wednesday's interest rate decisions from the Federal Reserve.
As for the FOMC's call on the Fed Funds Rate, forecasters are calling for yet-another 3/4 point hike to raise the target rate to a range of between 3.75% and 4.0%. And, given last week's personal spending report along with continued price increases -- albeit slowing ones -- that's not an unrealistic expectation.
Those same economists are also calling for jobs growth of 242,000, slightly accelerating from September's growth. That should be just enough to ratchet the unemployment rate down from 3.6% to 3.5%. Given what's supposed to be a waning economy, this is surprising strength that could at least partially explain the persistent inflation.
Payroll Growth and Unemployment Rate Charts
(Click on image to enlarge)
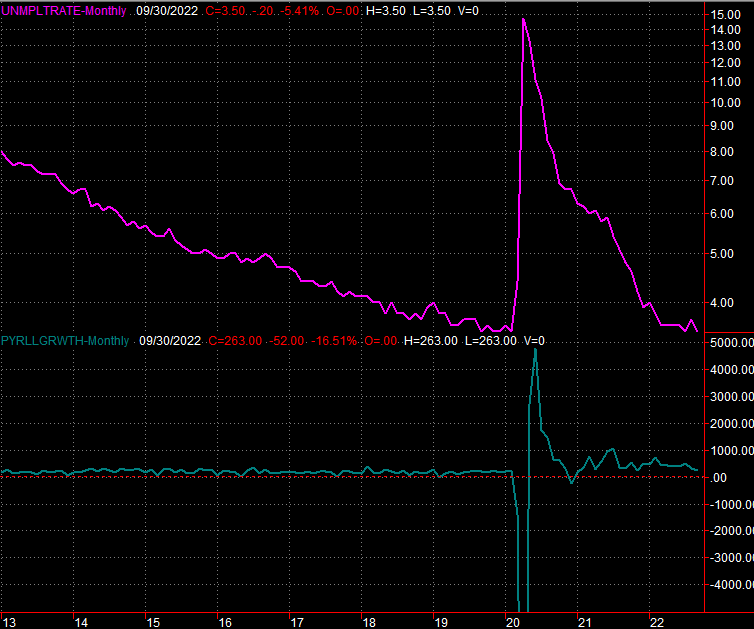
Source: Bureau of Labor Statistics, TradeStation
There's another data set due this week that's worth keeping tabs on though. On Tuesday the Institute of Supply Management will releases its Manufacturing Index figure for October, with the services version of the index coming on Thursday. Both have remained above the critical 50 level for several months now, but both have also been edging lower. While the services measure is projected to hold above 50.0, the economic slowdown is believed to have up-ended the nation's factory activity enough to pull the ISM Manufacturing below 50.0, to 49.8. That's at least a modest red flag.
ISM Manufacturing and Service Index Charts
(Click on image to enlarge)
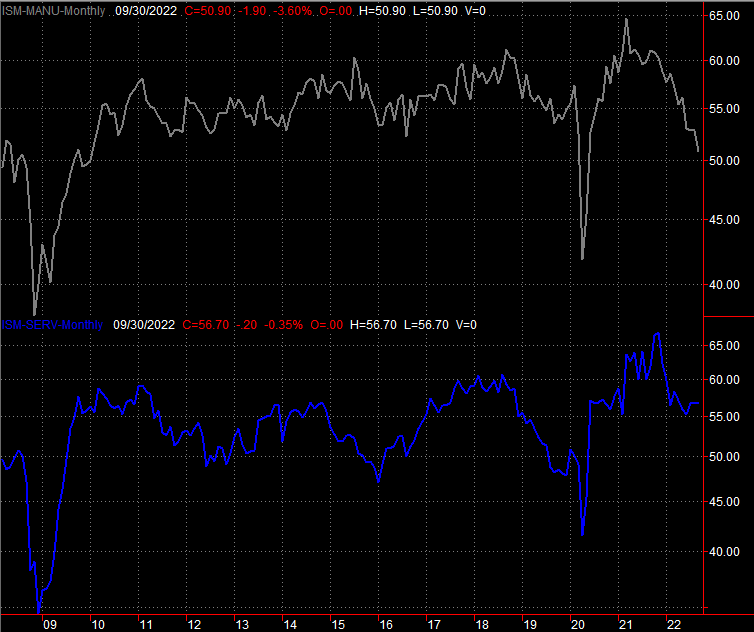
Source: Institute of Supply Management, TradeStation
Stock Market Index Analysis
A week ago we acknowledged the market's ability to punch through a couple of key technical ceilings opened the door to more of the same. Although it was a touch-and-go effort, stocks made good on that hint, driving through more resistance.
Take a look at the daily chart of the S&P 500 below. The index crossed above the 20-day moving average line (blue) a couple of weeks back, and last week it continued on to cross above its 50-day moving average line (purple) on Friday... after bumping into resistance there for the better part of the middle of the week. The 100-day moving average line (gray) stopped the effort that same day, but all in all it was a solid success. The more of these barriers it can break through, the easier it becomes to push through others. The move also jibes with the timing of the beginning of the usual year-end bullishness.
S&P 500 Daily Chart, with VIX and Volume
(Click on image to enlarge)
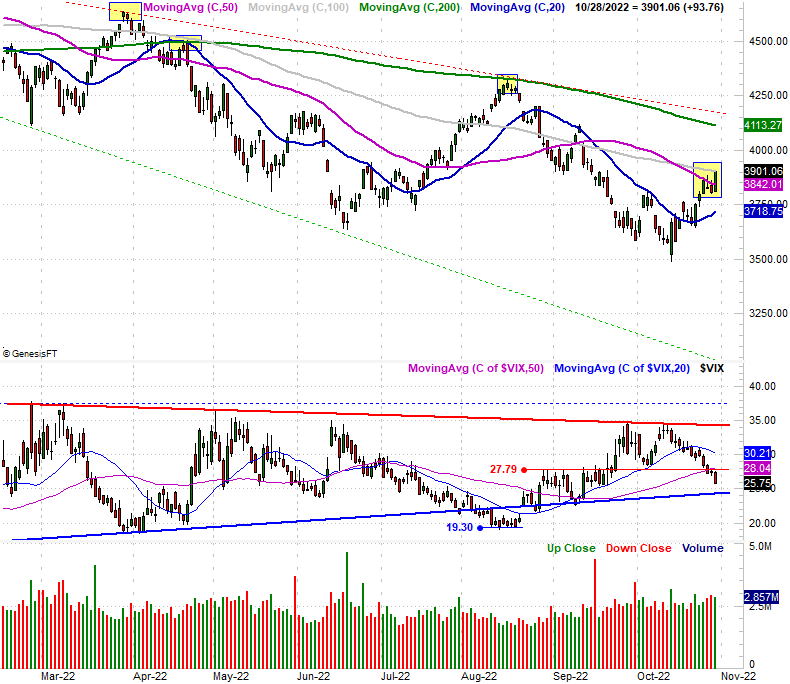
Source: TradeNavigator
Except, not every index is making as much forward progress.
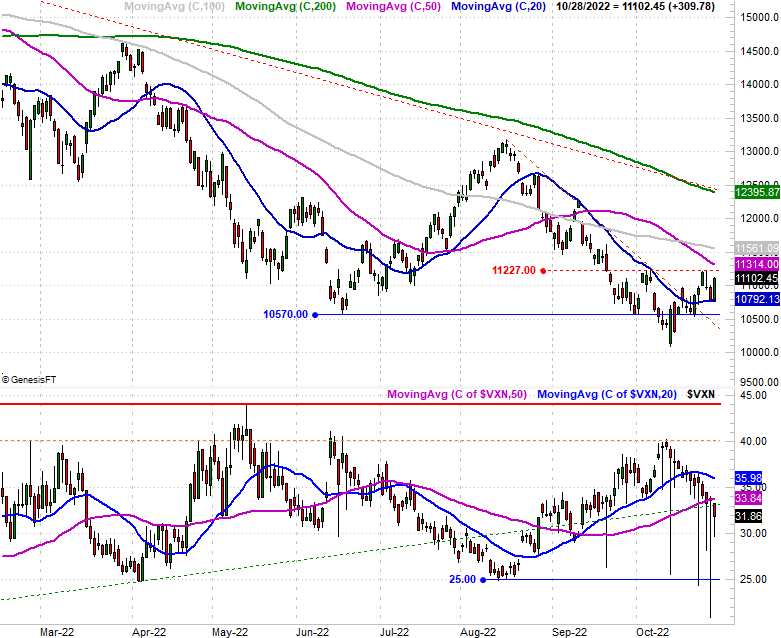
We're talking about the NASDAQ Composite, mostly. While it was able to find support last week at the very 20-day moving average line (blue) that had been resistance for so long, the composite didn't clear its 50-day line at 11,314 last week; it didn't even test it. In fact, if anything the NASDAQ only better defined and strengthened a technical ceiling developing at 11,227, where it peaked for a second time this month.
NASDAQ Composite Daily Chart, with VXN
(Click on image to enlarge)
Source: TradeNavigator
It's curious though. While we typically don't follow it, it's worth noting this week that the Dow Jones Industrial Average made a surprisingly bullish breakthrough, driving above its 200-day moving average line (green) at 32,643 on Friday... the last of any moving average lines that might act as a ceiling. The only other resistance from here is the line that connects all the key highs going back to early January. It's currently at 33.360. Granted, Apple helped - a lot. Apple doesn't account for anywhere near the entirety of the Dow, however.
Dow Jones Industrial Average Daily Chart, with Volume
(Click on image to enlarge)
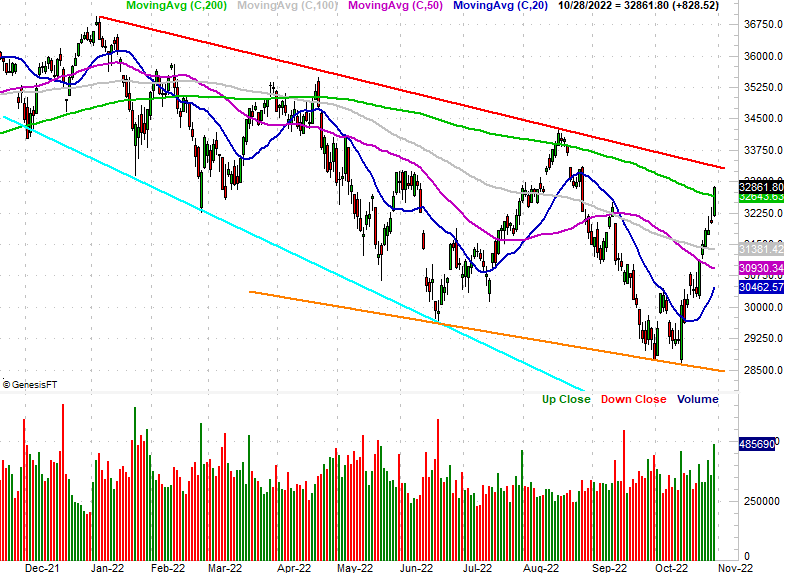
Source: TradeNavigator
There's a sound explanation for the disparity. The Dow Jones Industrial Average tends to consist of the most established and safest blue chips, whereas the NASDAQ Composite is laden with more than its fair share of risky growth stocks; the S&P 500 is somewhere in between. In our current wobbly environment, traders may well be shunning risk and looking for safety.
The thing is, even the safest of stocks can't rally as a group if the market as a whole is moving lower. It's not moving lower right now, to be sure. Indeed, the NASDAQ typically leads, higher and lower. Given the NASDAQ Composite's suspicious pause under a couple of important technical resistance lines though, stocks are anything but firmly bullish here.
Backing out to a weekly chart of the NASDAQ is where we get the most perspective on what's happening here, and what has to happen next for any index to have a good fighting chance at continued bullishness. The composite found the expected support around the 61.8% Fibonacci retracement line at 10,273, bounding up and off of it three weeks ago. There's a thick band of resistance all the way up to 12,520 though. The index will need to push through all of it for things to turn decidedly bullish.
NASDAQ Composite Weekly Chart, with VXN
(Click on image to enlarge)
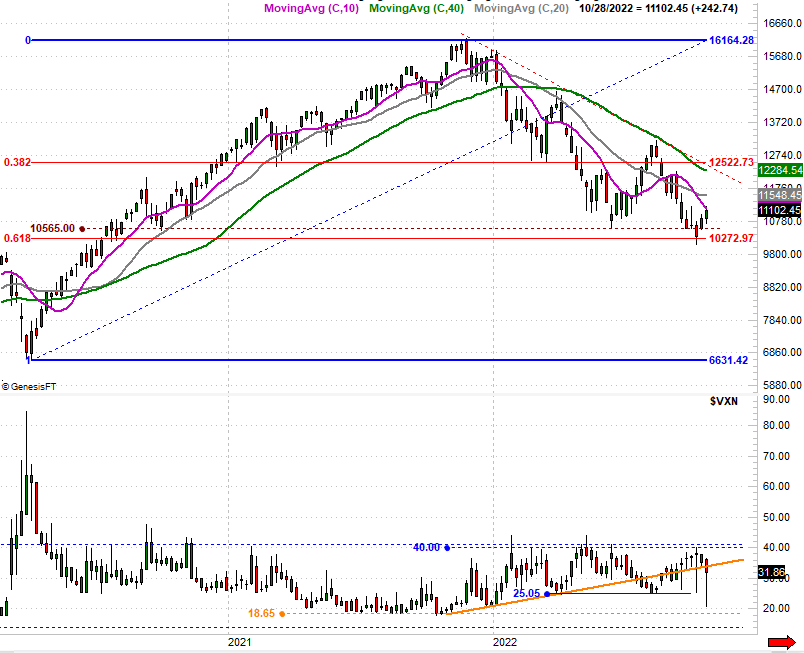
Source: TradeNavigator
More By This Author:
Weekly Market Outlook – Talk About A Bullish Head-FakeMeta Might Be Close to a Bottom. Or Not. The Chart Hints.
Weekly Market Outlook - As Rough As Friday Was, The Bulls Still Have A Fighting Chance

Comments
Log in or sign up to join the conversation.