
The market mustered a gain last week, but thanks to Friday's rout, just barely. The S&P 500's close of 3639.66 was just 54 points better than the prior week's last trade, leaving the index back within easy reach of a major technical floor.
And at this point, things could easily go either way. Most of the indices held above critical support levels despite testing them on Friday, but most of the indices bumped into technical resistance right where you'd expect them to in the middle of last week.
We'll look at both arguments below, and come to a conclusion about which is one the better of the two. First though, let's review last week's biggest economic announcements and preview what's coming this week.
Economic Data Analysis
It was a pretty busy week last week in terms of economic data. But, there's little doubt as to the biggie... Friday's jobs report for September. We'll start there.
In simplest terms, it was pretty good. The 263,000 payrolls added last month was the slowest job-growth rate in several months, but that makes sense -- most everyone who seems to want a job has a job. Between these newly-added positions and the number of people who voluntarily removed themselves from the labor pool, the unemployment rate was dialed back from 3.7% all the way to a 3.5%... tying the multi-year low reached back in February of 2020, right before the COVID-19 pandemic wrecked everything.
Payroll Growth and Unemployment Rate Charts
(Click on image to enlarge)
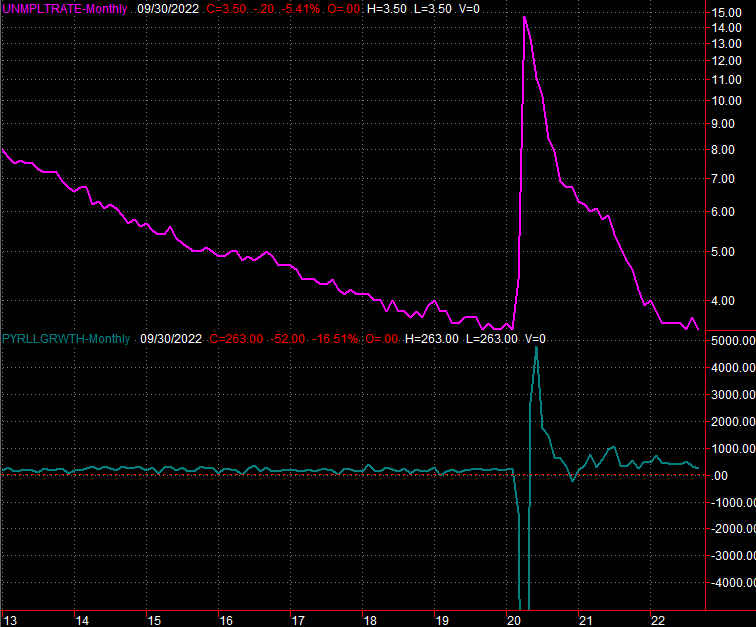
Source: Bureau of Labor Statistics, TradeStation
This is a problem, and the reason stocks rolled over on Friday despite the bullish start to the session. With some time to think about it, traders realized this jobs report gives the Fed plenty of room and reason to proceed with its planned rate hikes; there had been some talk that the FOMC might dial back its previous plans to raise rates through late next year.
The only other items of real interest served up last week was the Institute of Supply Management's regular monthly measures of economic activity. The services index fell just a bit, but rolled in a hair above expectations. The manufacturing index, however, fell from 52.8 to 50.9, blowing past expectations of 52.0.
ISM Services and Manufacturing Index Charts
(Click on image to enlarge)
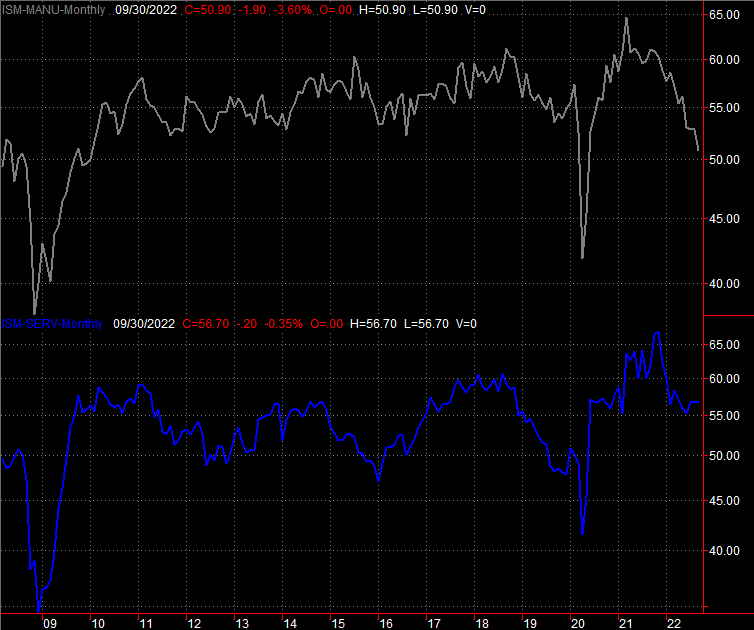
Source: Institute of Supply Management, TradeStation
It could be worse. Both indexes are still above the critical 50 level, and the services index appears to be leveling off. The manufacturing data, however, appears to be accelerating its downtrend. One more bad month could pull it under 50, and it's already at its lowest level in years with the exception of the short-lived plunge in early 2020, when the pandemic arrived and halted most economic activity.
This isn't a prediction, but this is what the onset of a recession would look like.
Everything else is on the grid.
Economic Calendar
(Click on image to enlarge)
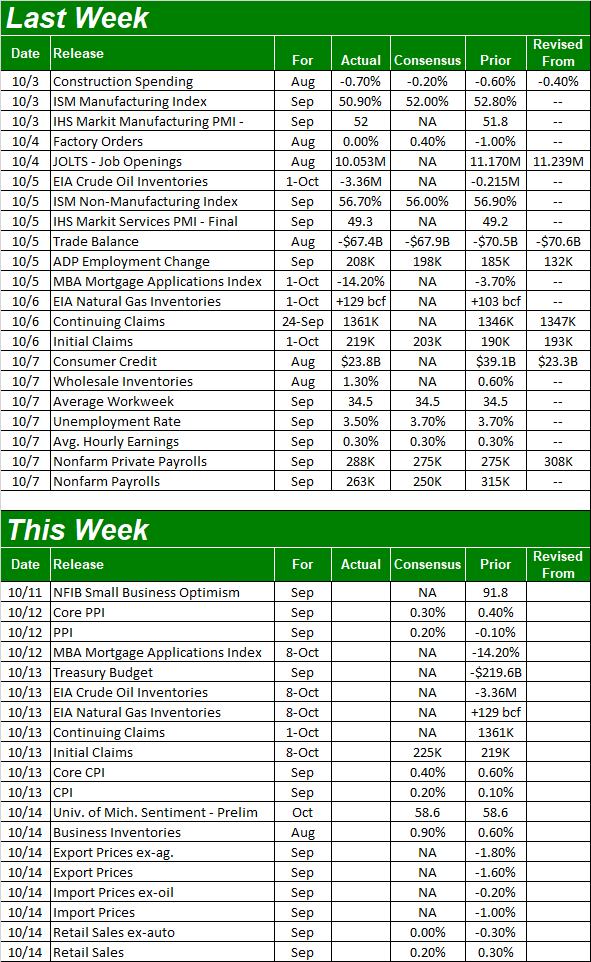
Source: Briefing.com
This week will shed a great deal of light on the current condition of the economy, kicking off on Wednesday with a look at last month's producer inflation. Economists aren't expecting any relief, with or with food and fuel prices factored in. September's consumer inflation report will be posted on Thursday. Don't look for any meaningful relief here either, with more price increases in the cards around the recent pace. Again, removing food and gas from the equation won't change things much.
Consumer and Producer Inflation Charts
(Click on image to enlarge)
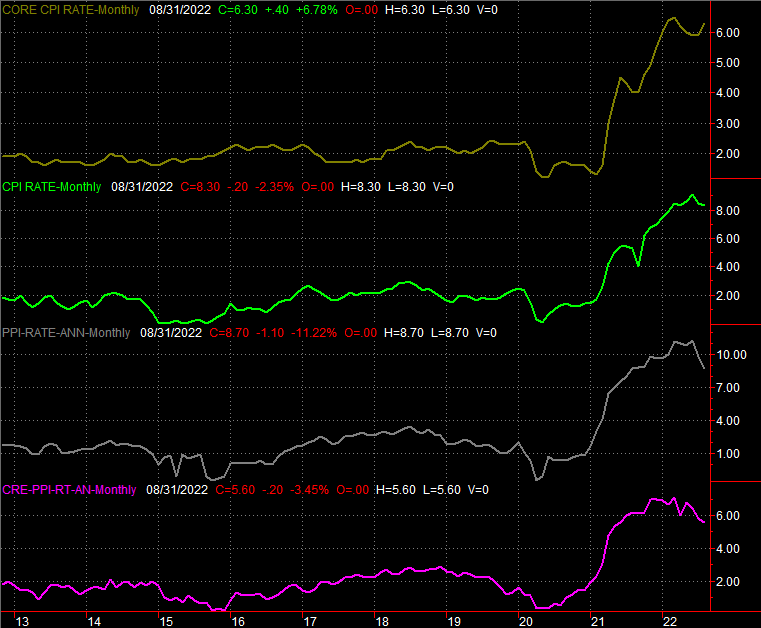
Source: Bureau of Labor Statistics, TradeStation
If inflation remains as brisk as forecasters anticipate, the Federal Reserve again has good reason to go ahead and ratchet up rates even though it's clearly spooking markets.
A disappointing retail sales report on Friday could do the same... and expectations aren't encouraging. Economists believe last month's retail consumption will be flat (on an adjusted basis) with August's figures, while adding automobiles to the mix will only drive tepid growth.
Retail Sales Charts
(Click on image to enlarge)
Source: Census Bureau, TradeStation
Granted, even a flat reading is an improvement from August's decline. As the chart makes clear though, retail spending growth has already quickly slowed to a crawl. It's not yet a disaster, but as was the case with the ISM figures, this is what things look like at the onset of a recession.
Stock Market Index Analysis
When the bulls most needed to make a statement, they didn't.
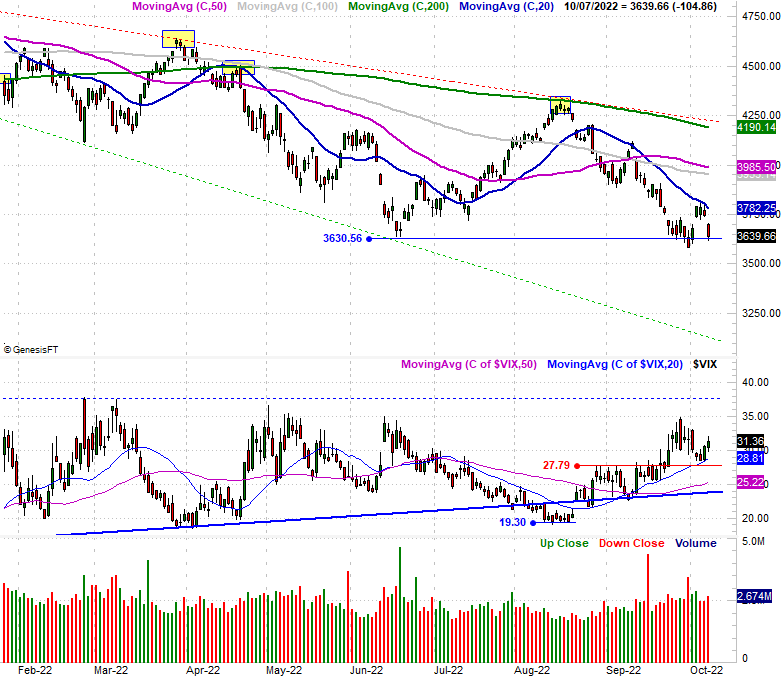
How so? Take a look at the daily chart of the S&P 500 below. In a complete 180-degree turnaround from the bearish end to the week two weeks ago, stocks soared out of the gate on Monday, and followed through in a big way on Tuesday. On Wednesday and Thursday though. the S&P 500 tested the 20-day moving average line (blue) without ever actually moving above it. (If there's going to be any ceiling to worry about first, the 20-day line is it.) Resultingly, the bulls threw in the towel on Friday to essentially drag the index back to where it ended the previous week.
S&P 500 Daily Chart, with VIX and Volume
(Click on image to enlarge)
Source: TradeNavigator
And yet, there's still a chance the market could recover. It's just going to have to do it soon... as in the very first thing this week.
Take another look at the daily chart of the S&P 500 above. While Friday was a (big) loser, the index at least held above the 3630 level where it made a major low on June. That floor was broken on Friday, but given how firmly index moved back above that line on Monday, that's forgivable. If the S&P 500 breaks back under that support level though, the bulls may not be nearly as eager to prop it back up again. They're more likely to let that selling effort just run its full course.
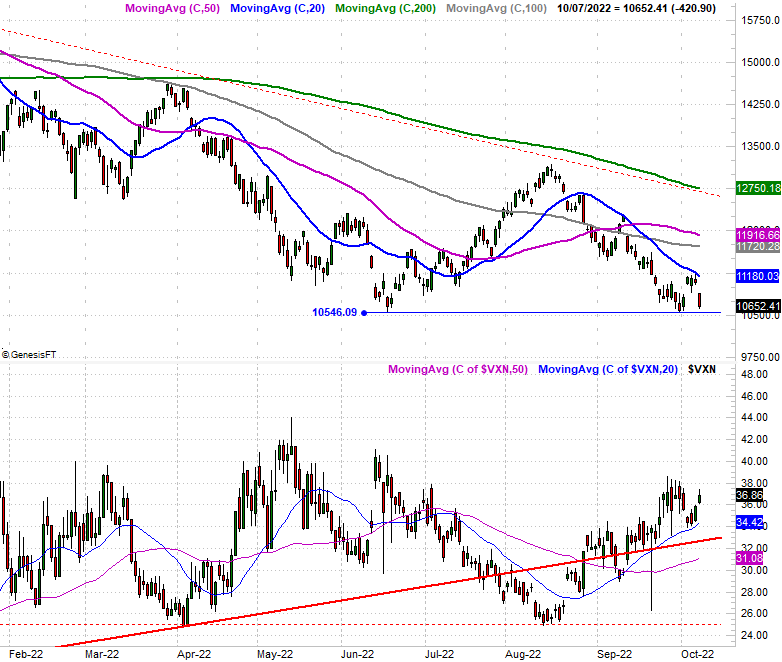
Underscoring this analysis is the fact that the NASDAQ Composite's daily chart is dropping the exact same hints. Those are, the composite tested its 20-day moving average on Thursday, and though it crashed on Friday, the NASDAQ didn't fall below what's quickly becoming a very reliable floor at 10,546.
NASDAQ Composite Daily Chart, with VXN
(Click on image to enlarge)
Source: TradeNavigator
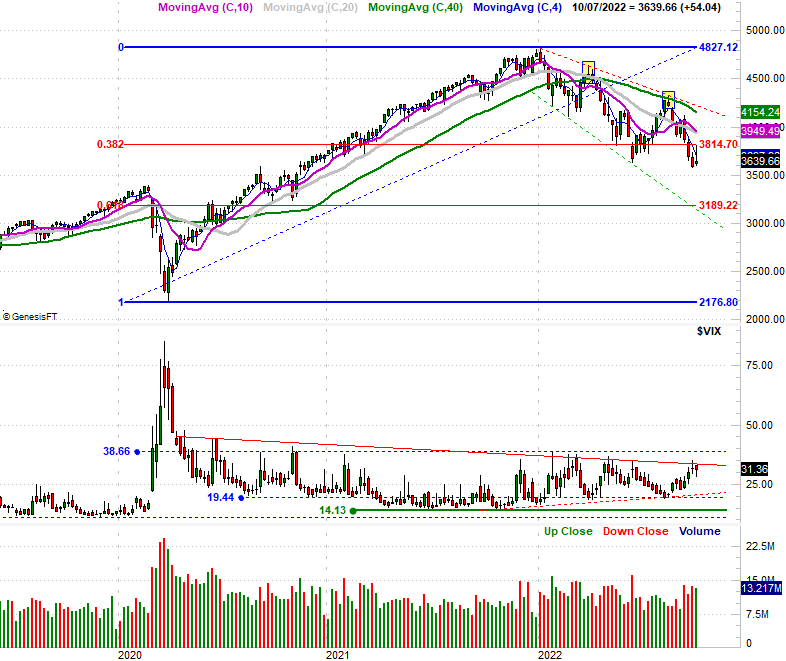
Here's the weekly chart of the S&P 500, for a little -- or perhaps a lot -- more perspective.
From this vantage point we can see the bigger trend is bearish. We can also see that the index is range-bound between diverging support and resistance lines (dashed). If these boundaries are to continue being tested, it means the S&P 500 has a lot more ground to give up before the final bottom is made. How much ground? The lower boundary (green, dashed) is right around 3000 at the point where it could feasibly be tested. Yikes.
S&P 500 Weekly Chart, with VIX and Volume
(Click on image to enlarge)
Source: TradeNavigator
There's another prospective floor that could prevent a rout from cutting that deep, however.
See all the horizontal lines plotted on the weekly chart? They're Fibonacci retracement lines, which represent the market's most organic ebb-and-flow reversal points. The one we're most interested in now is the 61.8% retracement line right around 3190, near where the index found resistance and support back in 2020. A tumble back to that level would be ideal, in that it would likely be "enough" of a selloff at the right time to serve as not just a major low, but perhaps a bear market bottom. The 3190 area is 34% below the S&P 500's January peak, which as it turns out is the long-term average loss for a bear market.
The only thing slightly wrong with that prospect is the calendar. Bearish usually ends and bullishness usually begins in mid-October. It could be early November before the S&P 500 gets a chance to make a logical low. Then again, that would be right around election time, which certainly sets the stage for a change of the market's direction.
Again though, none of the indices have actually broken under the key support levels that would suggest lower lows are in the cards. Let's stay on the sidelines for the time being.
More By This Author:
Weekly Market Outlook – The Fed Shocked The Market By Doing Exactly What Was ExpectedMidweek Update: Wednesday's Gain Is Impressive, But Not Game-Changing... At Least Not Yet
Weekly Market Outlook - Stocks Go 0 For 3 (And That's Not Even The Worst Of It)

Comments
Log in or sign up to join the conversation.