Watch This Key Bar For A Make-Or-Break Signal
Image Source: Unsplash
Watch the video from the WLGC session before the market opens on 19 Nov 2024 to find out the following:
- Is the market (SPX) losing momentum, or is this just a healthy pullback in an ongoing uptrend?
- Could the recent spike in supply and localized volatility signal a deeper correction ahead?
- How to use the smaller timeframe to identify the key resistance level and anticipate the market movement.
- And a lot more...
Video Length: 00:04:36
Market Environment
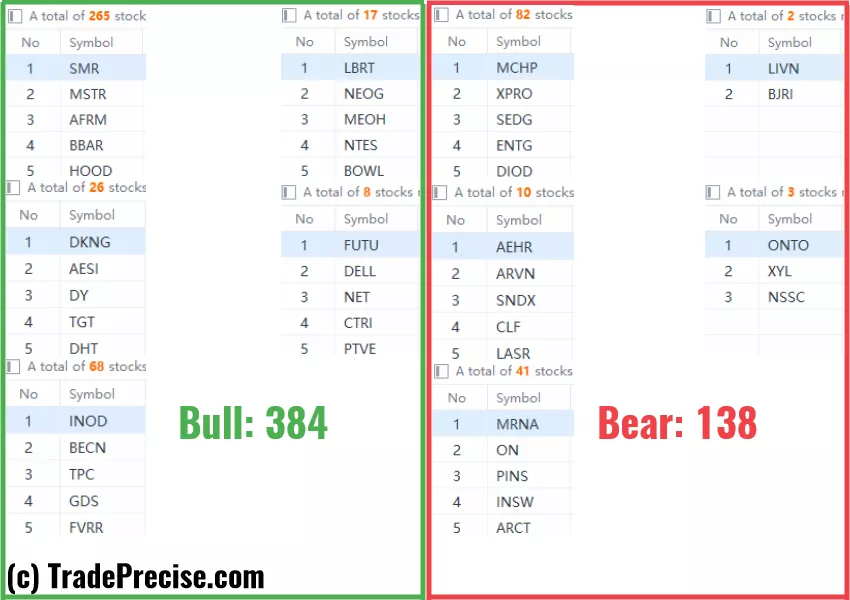
The bullish vs. bearish setup is 384 to 138 from the screenshot of my stock screener below.

3 Stocks Ready To Soar
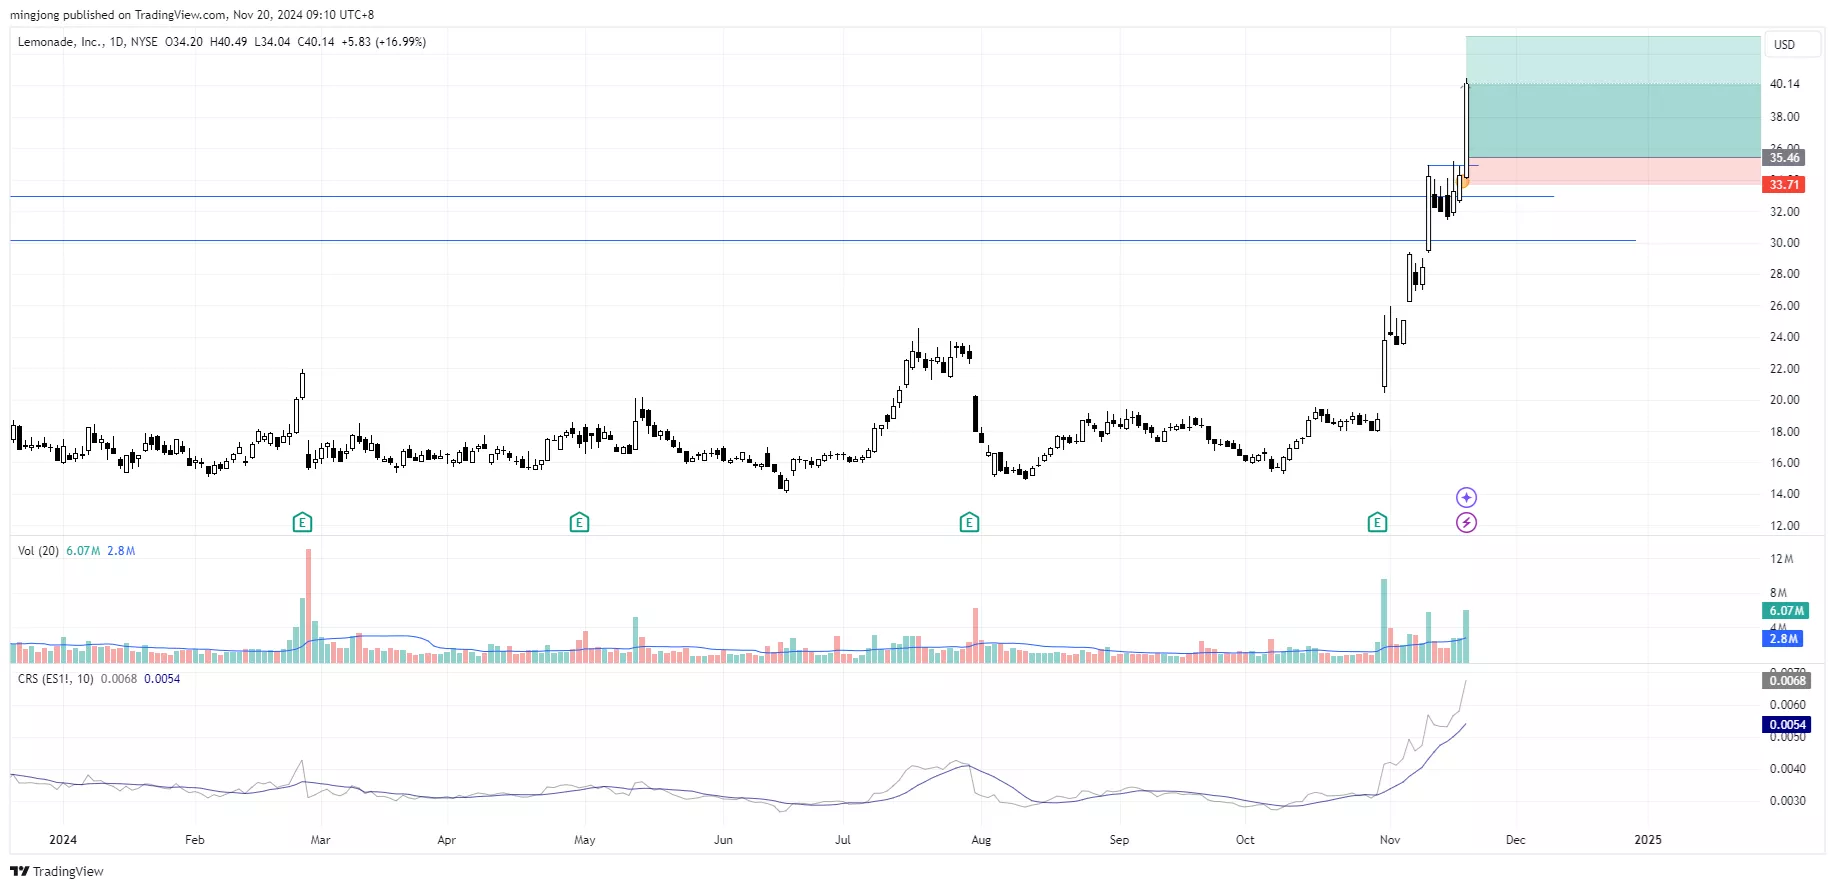
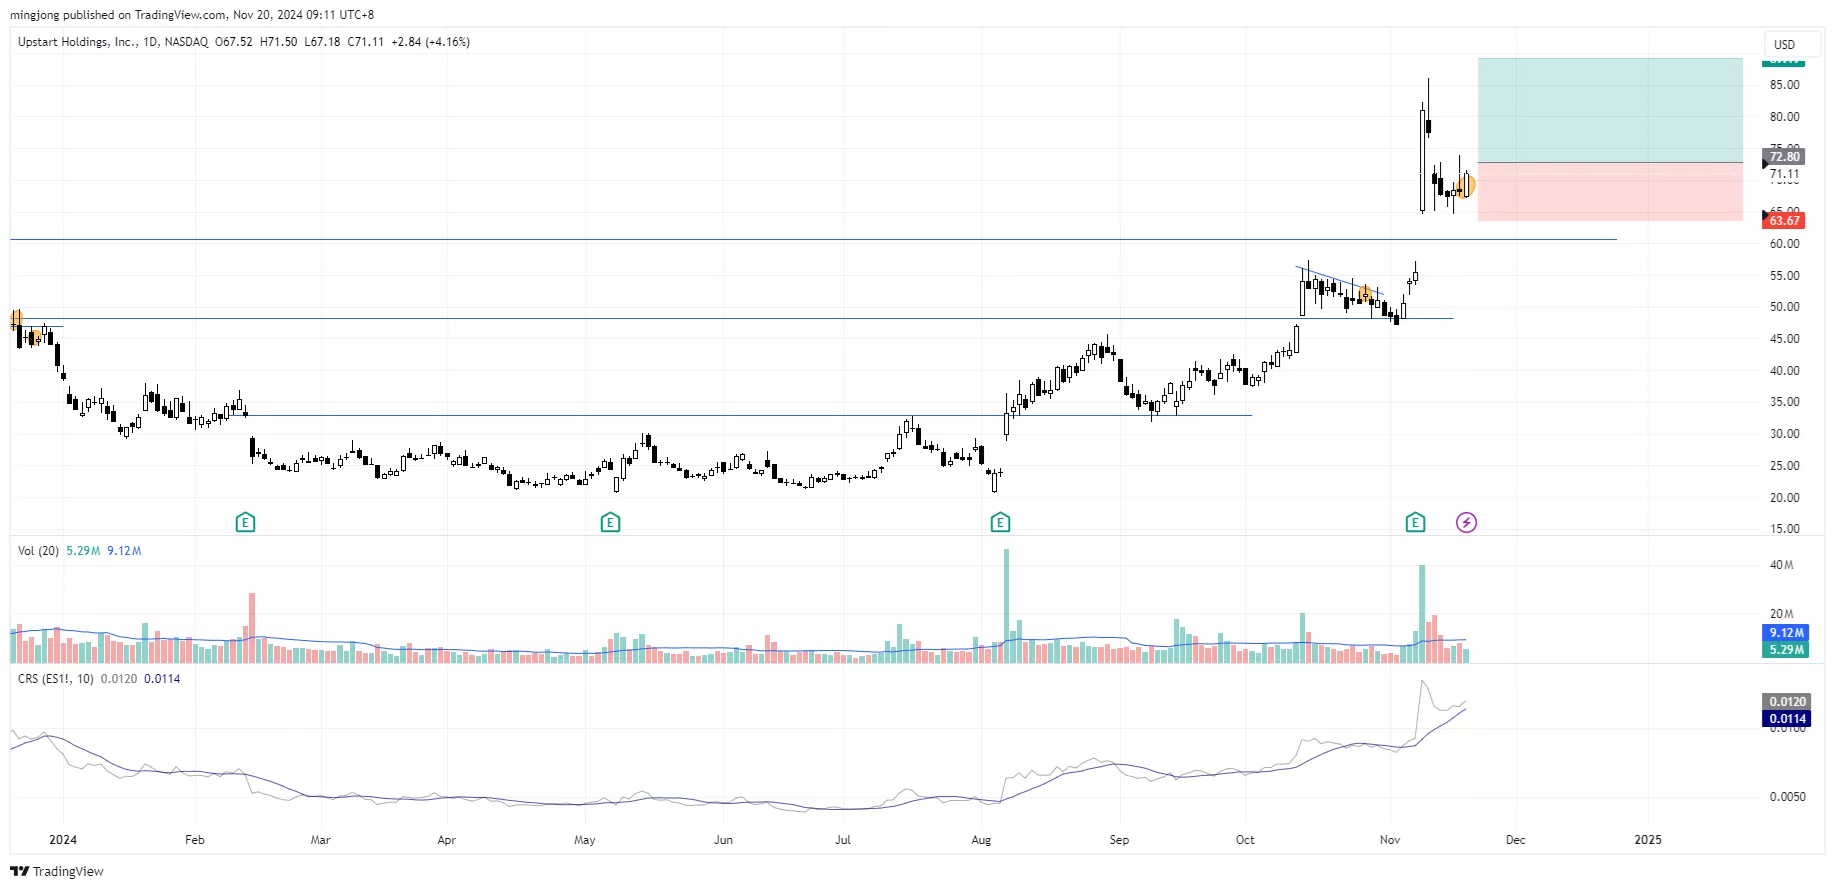
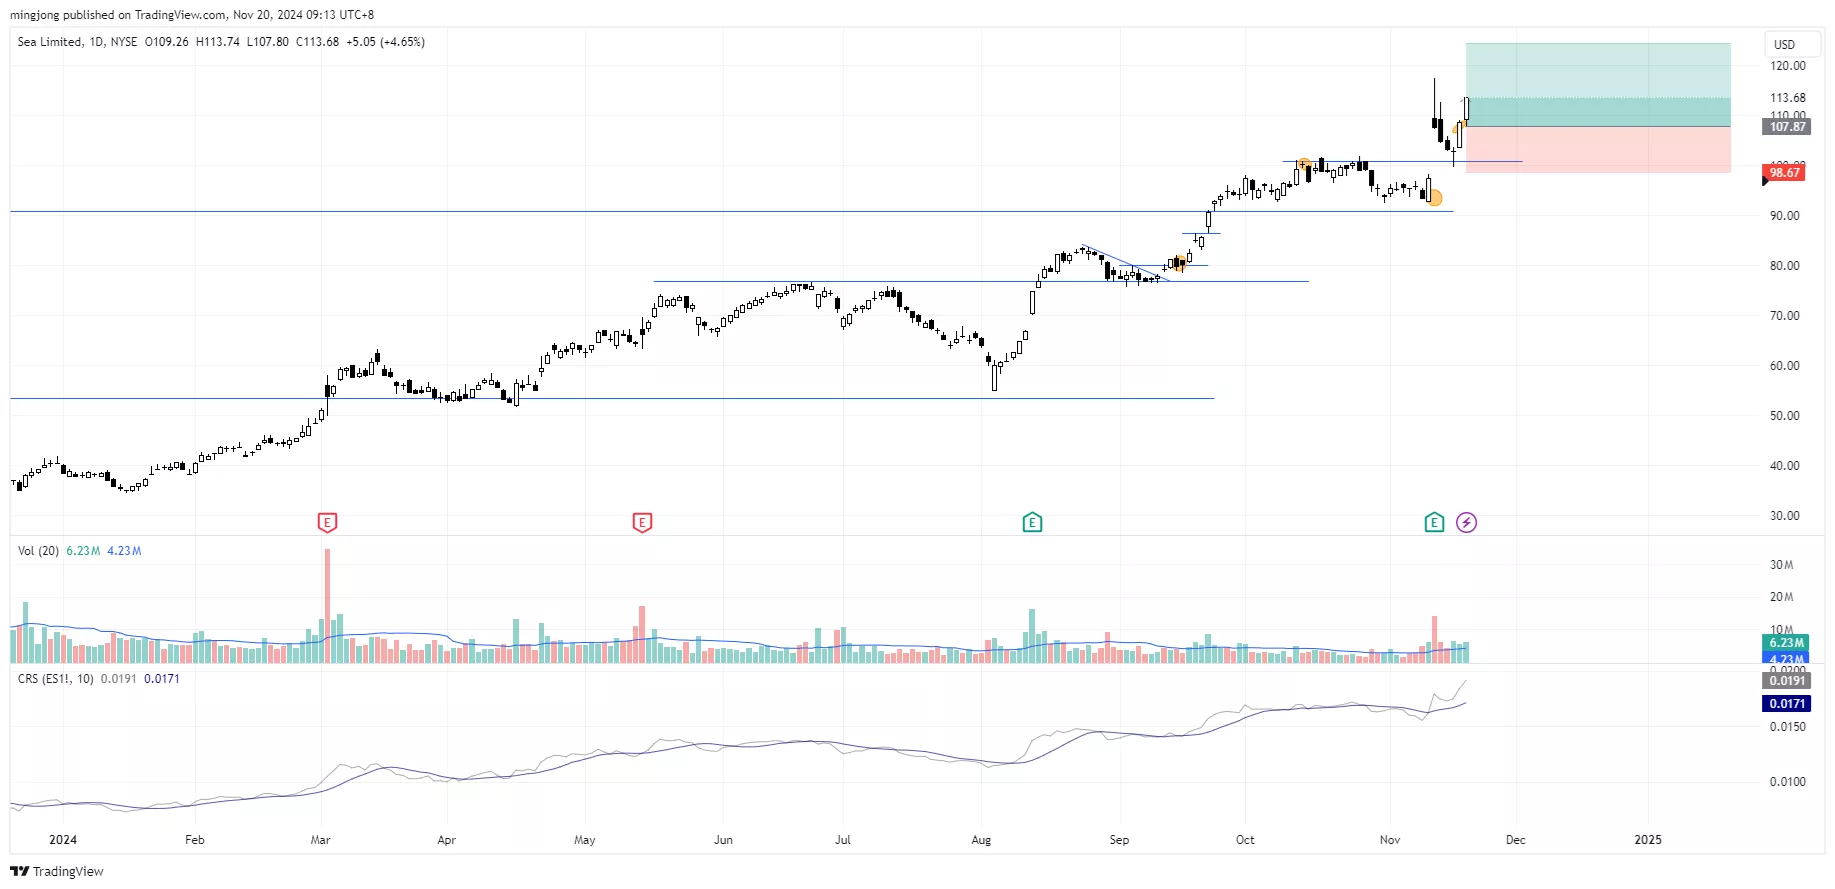
28 actionable setups including 8 growth stocks (check out 3 of the charts LMND, UPST, SE below) completed 2+ years of accumulation structure and are in the “sweet spot” to transit into uptrend (phase E) were discussed during the live session before the market open (BMO).
The pullback in the market since last Tuesday provided great reversal entries for many of those over-extended strong momentum stocks.
The plan mentioned in the market update on Monday to look for reversal entries to participate the continuation of the uptrend is still relevant.
(Click on image to enlarge)

(Click on image to enlarge)

(Click on image to enlarge)

More By This Author:
Election Pattern Alert: How Volatility And Demand Spikes Point To A Bullish 2025
Massive Rally In The S&P 500 If The Key Level Holds Up
Election Patterns: Could This Market Structure Signal The Next Big Move?
Disclaimer: The information in this presentation is solely for educational purpose and should not be taken as investment advice.


