

Image source: Pixabay
Volatility, the tendency of prices to fluctuate, is not just an academic construct – there are also products such as ETFs based on it.
Volatility has recently been quite low by historical standards.
Can we now expect an increase in volatility? Let’s take a look at its seasonal pattern.
Volatility over the course of the year
The chart below shows you the seasonal development of the CBOE volatility index, which is based on the S&P 500, over the past 34 years.
The horizontal axis shows the time of year, the vertical axis the level of volatility.
This allows you to see at a glance how volatility typically develops seasonally.
Volatility index, seasonal trend over 34 years
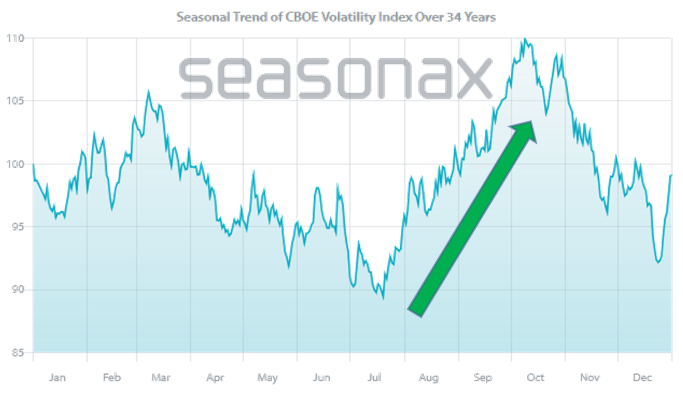
Volatility increases seasonally from mid-July. Source: Seasonax
As you can see, there is a pronounced seasonality of volatility.
The strongest seasonal increase occurs from mid-July to the beginning of October.
Fluctuations are now increasing seasonally!
Over the past 34 years, volatility between July 15 and October 7 has increased almost 80% of the time
In fact, it has risen every time in the past 10 years.
That could happen again now.
Nevertheless, most investors do not currently expect volatility to increase.
However, pay attention to the seasonal statistics. These tend to indicate stronger price fluctuations and possibly a storm.
A certain degree of caution on the stock market seems appropriate, and possibly also the purchase of volatility products.
More By This Author:
Can A Gucci Turnaround Lift Kering’s SA Share Price?
Crude Oil: Is The Next Price Surge Coming?
Is Volatility About To Breakout?


Comments
Log in or sign up to join the conversation.