
The race to build and power AI data centers is creating an interesting anomaly in the stock market. Despite the S&P 500 being up over 7% on the year, and the higher-beta stocks seemingly leading the way, utilities and industrials are the best-performing sectors. The surging demand for power drives utilities, while industrials benefit from building out the power grid infrastructure. So while utilities and industrials are having their day in the sun, we must start thinking about what other sectors or industries are benefiting from the power grid build expansion, but whose stocks are not leading the market.
At its core, the ability to produce electricity is dependent on the energy source used to create it. Currently, utilities rely most on natural gas, with coal and wind in a distant second and third. Furthermore, natural gas usage as a percentage of all sources used by the power grid is expanding. This is primarily because natural gas is cheap and abundant. Presuming the data center and power grid expansion continues, might the next beneficiary be natural gas companies? As a disclosure, our equity model holds two natural gas pipeline stocks (OKE and KMI) while our sector models hold an ETF of pipeline stocks (AMLP). Generally, the pipeline stocks have not performed nearly as well as the utilities and industrials, despite them also being a bet on infrastructure expansion with solid growth potential, higher-than-average dividends, and favorable government policy tailwinds.
Might they be among the stocks next in line to benefit from the infrastructure boom?

What To Watch Today
Earnings
(Click on image to enlarge)

Economy
(Click on image to enlarge)

Market Trading Update
Yesterday, we noted the big reversal rally from Friday’s sell-off and suggested that the rally needed to maintain its hold above the 20-DMA. Despite better-than-expected results from Palantir (PLTR), the market reversed its early morning rally and closed lower for the day. Notably, the market bounced off the bottom of the rising trend channel on Monday and is flirting with support at the 20-DMA. While the previous overbought conditions were somewhat reversed with the correction, there is still some additional work to complete that process. Furthermore, the momentum “sell signal” remains intact, suggesting that increased volatility may be with us for a while longer.
(Click on image to enlarge)

Technically, there is nothing wrong with the market as a normal pullback occurs. Retail investors continue to step in and “buy the dip,” as greed permeates the markets. However, earnings season is winding down, and earnings beats are getting a muted reaction. On average, stocks beating estimates are only outperforming by 55 bp vs. the 101 bp historical average. This is likely due to overly low analyst expectations. Meanwhile, earnings misses are being punished nearly twice as much as usual.

With earnings season concluding, Wall Street will turn its focus back to the economic data, which has not been good as of late. As such we continue to suggest maintain a focus on risk management for now until the market finds support that it can build off of.
Another View Of The Labor Market
We ran across an excellent analysis that helps us assess the recent weakness in the labor market. The following series of graphs and comments is courtesy of Parker Ross (@Econ_Parker).
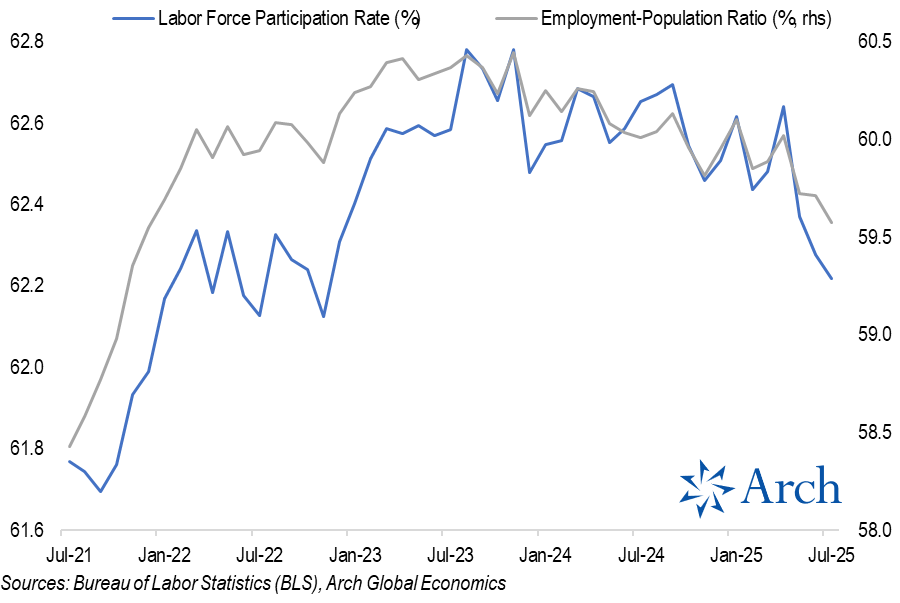
If not for collapsing labor force participation since April, unemployment would’ve climbed to 4.9% today instead of 4.25%.

The labor force participation rate dropped from a recent peak of 62.8% in Nov ’23 to 62.2% in July ’25. The pace of that decline accelerated sharply in May and has continued through July.
That “not in the labor force” segment of the unemployed surged in July. New entrants not finding jobs put 15bps of upward pressure on the headline unemployment rate.
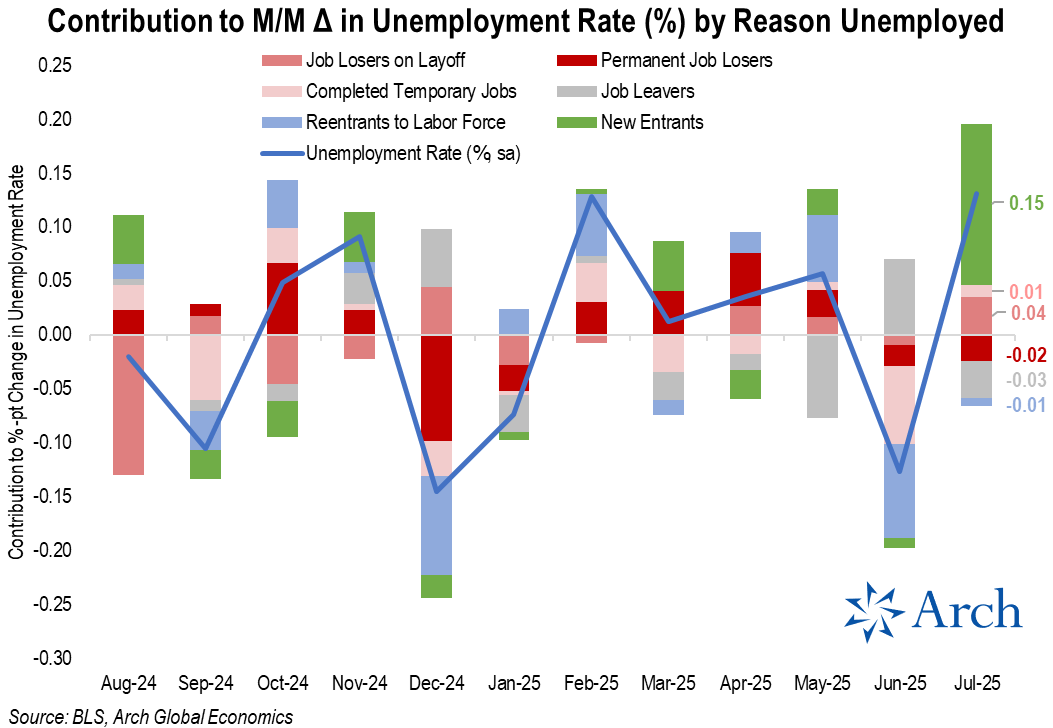
The new entrant/youth unemployment angle is not new, but it is clearly the segment of the labor market feeling the greatest softening in recent months.

Workers are increasingly resorting to part-time work as full-time employment has trended lower.

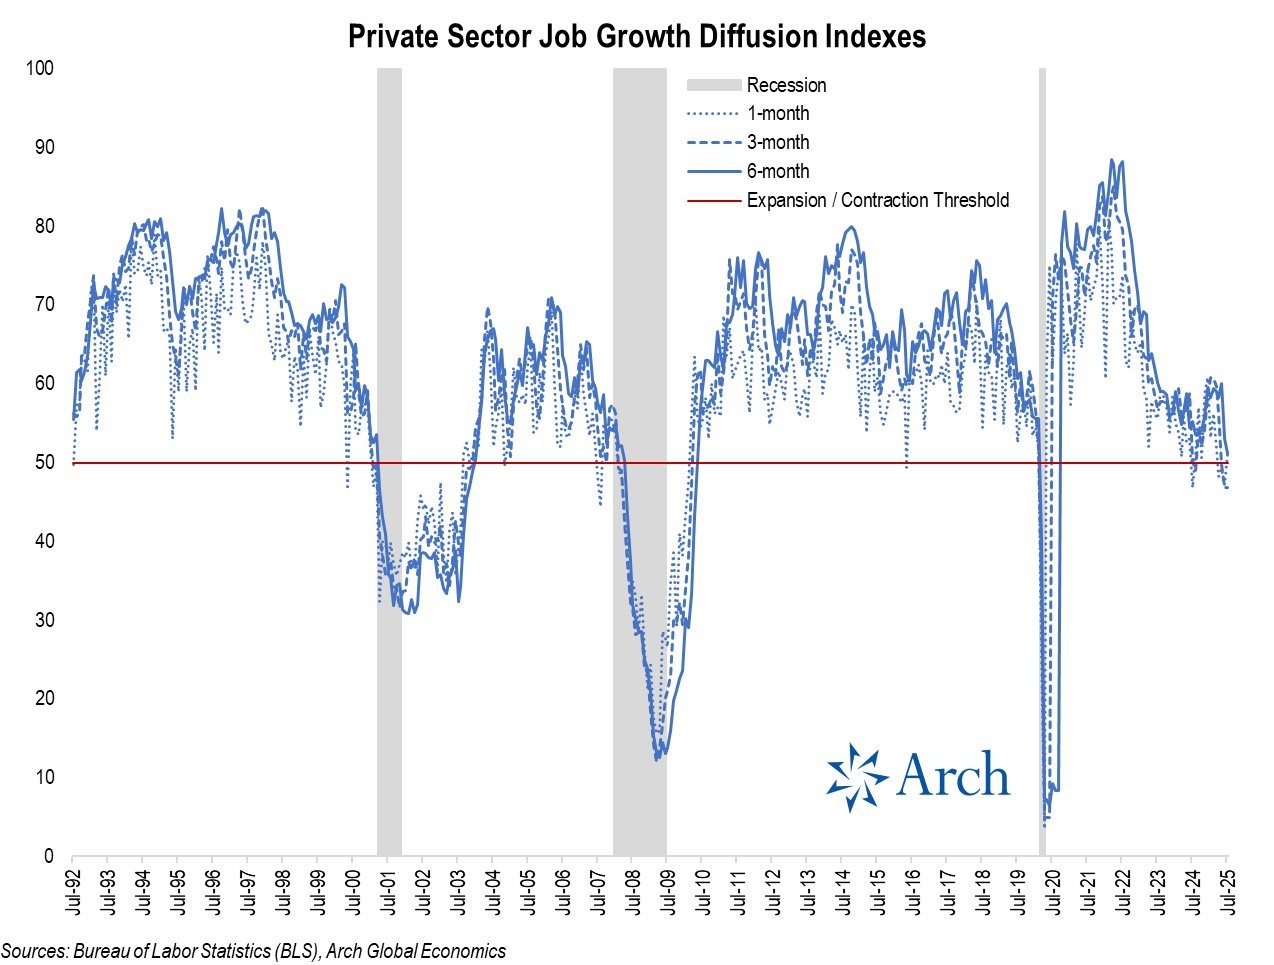
That brings me to my favorite metric from the establishment survey: the private job growth diffusion index, which reflects the breadth of job gains across industries. The 3m index dropped below the 50 expansion / contraction threshold back in May and remained at 46.8 in July, down from 60.8 back in Jan ’25.
How To Use Charitable Giving To Reduce Tax And Maximize Impact
Charitable giving can be a powerful component of your long-term financial plan. With the right strategy, giving can help you support the causes you care about while simultaneously reducing your tax burden and enhancing your legacy.
Whether you’re considering a donor-advised fund, establishing a charitable trust, or exploring private foundations, integrating philanthropy into your broader financial planning approach offers meaningful rewards for both you and your beneficiaries.
In this blog, we’ll walk through how high-net-worth individuals and families can use charitable giving to reduce taxes, manage wealth efficiently, and make a lasting impact.
Tweet of the Day

More By This Author:
Palantir Thrives On Trump PresidencyBull Streak Ends As August Begins
Does Trump Have A Valid Point About Rate Cuts?


Comments
Log in or sign up to join the conversation.