
U.S. Stocks - Visa Inc.
VISA INC. (V) Elliott Wave Analysis | Trading Lounge
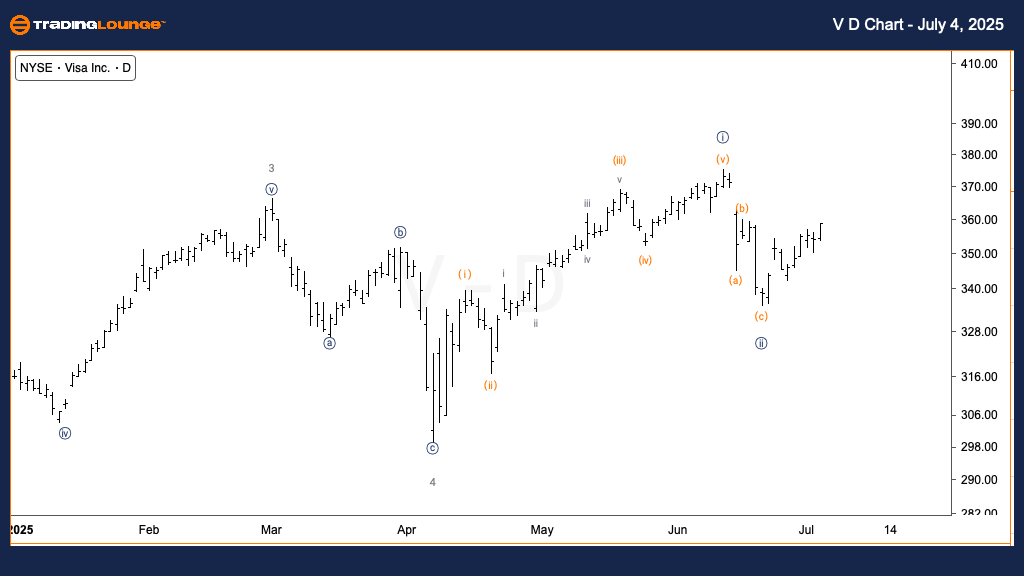
Visa Inc. (V) – Daily Chart
Elliott Wave Technical Analysis
- FUNCTION: Trend
- MODE: Motive
- STRUCTURE: Impulsive
- POSITION: Wave {iii} of 5
- DIRECTION: Upward in wave {iii}
- DETAILS: Bullish alternative favors further upside into wave {iii}, as price action extends into wave 5
Visa Inc. (V) is displaying a bullish trend setup on the daily chart. The current wave structure indicates an advancing wave {iii} of 5, within a larger impulsive sequence. This analysis supports the view that price is extending higher in wave 5, suggesting the beginning of a strong upside phase. If confirmed, this wave count indicates renewed buying momentum and a strengthening bullish structure in the final leg of this cycle.
Visa Inc. (V) – 1H Chart
Elliott Wave Technical Analysis
- FUNCTION: Trend
- MODE: Motive
- STRUCTURE: Impulsive
- POSITION: Wave (iii) of {iii}
- DIRECTION: Upward in wave (iii)
- DETAILS: Current movement may be a subdivision of wave {iii}, assuming wave {ii} has bottomed. Alternate view: wave (b) of {ii} still developing.
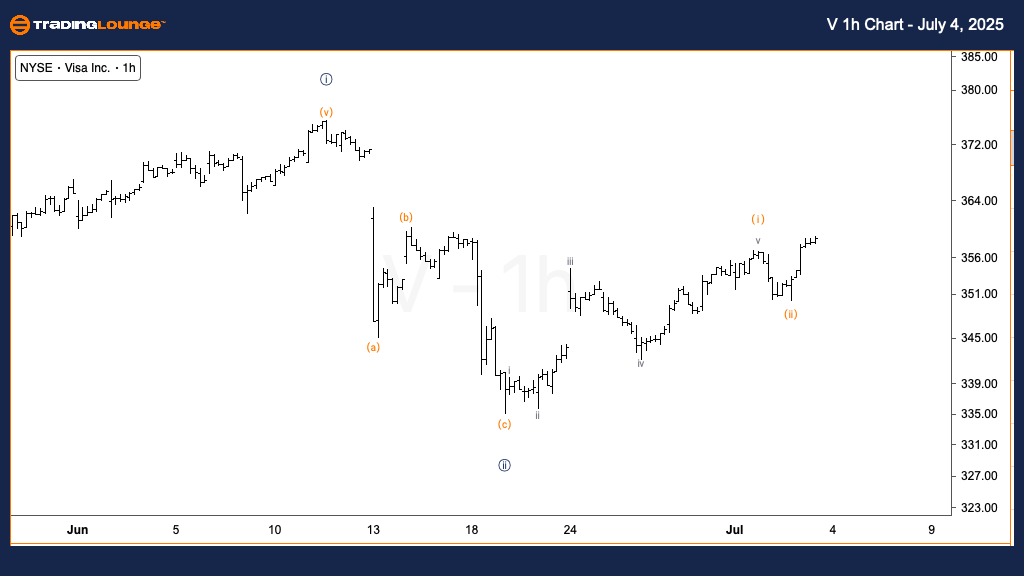
On the 1-hour chart, the structure is forming wave (iii) of {iii}, suggesting that a new impulsive move is underway. The bullish count assumes wave {ii} is complete, setting the stage for further gains in wave (iii). However, an alternative scenario indicates the possibility of the price still being within wave (b) of {ii}. Confirmation through sustained upward movement will be key to validating the bullish forecast and confirming the next phase in Visa’s Elliott Wave cycle.
Technical Analyst: Alessio Barretta
More By This Author:
Elliott Wave Technical Forecast: Newmont Corporation - Friday, July 4
Elliott Wave Technical Analysis Riot Platforms, Inc.
Elliott Wave Technical Analysis: New Zealand Dollar/U.S. Dollar - Friday, July 4
At TradingLounge™, we provide actionable Elliott Wave analysis across over 200 markets. Access live chat rooms, advanced AI & algorithmic charting tools, and curated trade ...
more

