
NZDUSD Elliott Wave Analysis | Trading Lounge
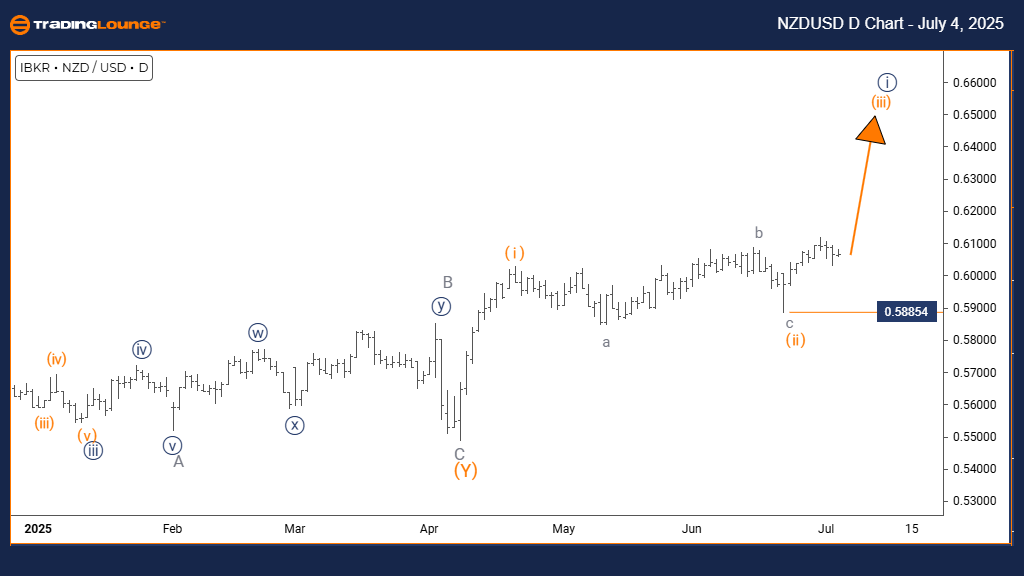
New Zealand Dollar / U.S. Dollar (NZDUSD) – Daily Chart
Elliott Wave Technical Analysis
- FUNCTION: Bullish Trend
- MODE: Impulsive
- STRUCTURE: Orange Wave 3
- POSITION: Navy Blue Wave 1
- DIRECTION NEXT HIGHER DEGREES: Orange Wave 3 (in progress)
- DETAILS: Orange Wave 2 appears complete; Orange Wave 3 is now active
- Wave Cancel Invalid Level: 0.58854
The NZDUSD daily chart reveals a bullish trend through Elliott Wave analysis. The current impulsive wave structure is identified as orange wave 3, part of the larger navy blue wave 1. This phase typically reflects the strongest segment in an Elliott Wave cycle, where sharp price advances occur with minimal pullbacks.
Following the completion of orange wave 2, the price has transitioned into orange wave 3, suggesting the potential for sustained upside. This wave, known for its strength and momentum, is part of the broader bullish structure within navy blue wave 1.
Traders should closely monitor the wave invalidation level at 0.58854. A drop below this point would invalidate the current count. As long as the price remains above, the structure supports further upward movement in the NZDUSD.
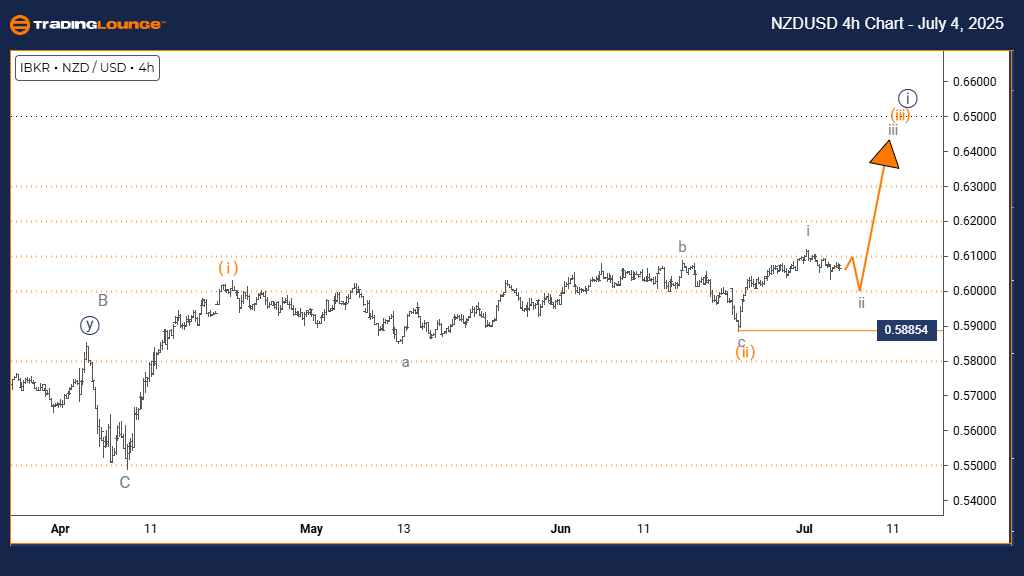
New Zealand Dollar / U.S. Dollar (NZDUSD) – 4H Chart
Elliott Wave Technical Analysis
- FUNCTION: Counter Trend
- MODE: Corrective
- STRUCTURE: Gray Wave 2
- POSITION: Orange Wave 3
- DIRECTION NEXT HIGHER DEGREES: Gray Wave 3
- DETAILS: Gray Wave 1 is complete; Gray Wave 2 currently unfolding
- Wave Cancel Invalid Level: 0.58854
The NZDUSD 4-hour chart reflects a corrective counter-trend structure, with price action now forming gray wave 2 within the broader orange wave 3 context. This suggests a temporary retracement phase, commonly seen before resumption of the primary trend.
After completing gray wave 1, the pair is navigating through gray wave 2, likely exhibiting moderate pullbacks or range-bound movement. Once completed, the anticipated gray wave 3 may resume the dominant uptrend.
Traders are advised to track developments within gray wave 2 and watch the 0.58854 invalidation level. A sustained breach would negate the current wave structure. Otherwise, conditions support a continuation of the upward trend once gray wave 2 ends.
Technical Analyst: Malik Awais
More By This Author:
Elliott Wave Technical Forecast: Newmont Corporation - Friday, July 4
Indian Stocks Dr. Reddy's Laboratories
Unlocking ASX Trading Success: Coles Group Limited - Thursday, July 3


Comments
Log in or sign up to join the conversation.