
U.S. Stocks: The Walt Disney Co.
DIS Elliott Wave Analysis – Trading Lounge
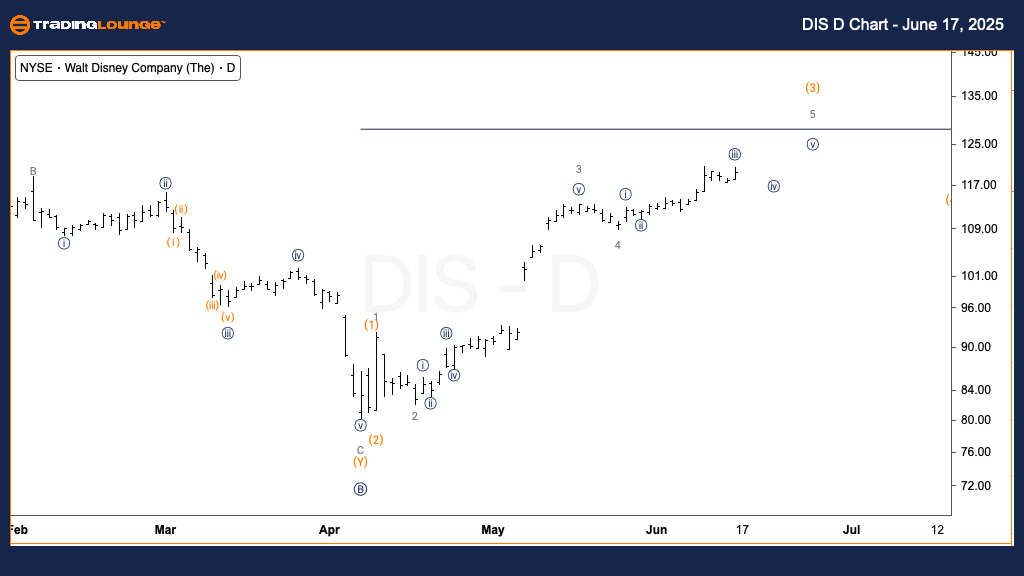
The Walt Disney Co. (DIS) – Daily Chart Analysis
DIS Elliott Wave Technical Overview
Function: Trend
Mode: Impulsive
Structure: Motive
Position: Wave (3) of C
Direction: Uptrend in wave (3)
Details: The chart indicates further upside potential in wave 5. The price action appears to be moving higher towards the peak of Minor Group 1, suggesting continued bullish momentum.
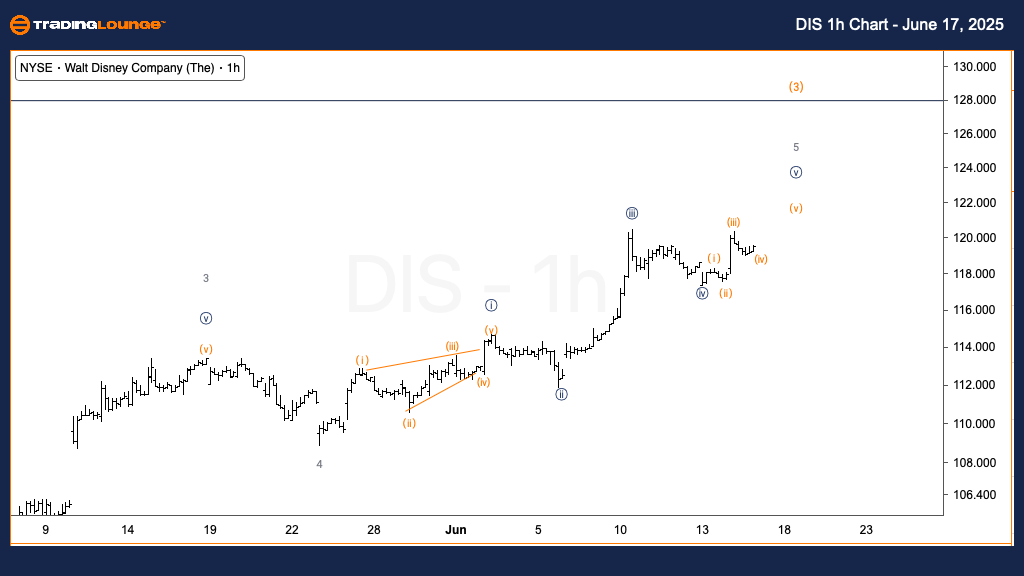
The Walt Disney Co. (DIS) – 1H Chart Analysis
DIS Elliott Wave Technical Overview
Function: Trend
Mode: Impulsive
Structure: Motive
Position: Wave {v} of 5
Direction: Uptrend in wave {v}
Details: A more cautious projection is being considered, indicating DIS could be nearing the final phase of wave {v} of 5. This may lead to a short-term high and a minor corrective pullback. However, the overall trend remains upward.
Summary of DIS Technical Analysis
This analysis includes both the daily and 1-hour charts of Disney (DIS) to evaluate the current wave structure and price movement potential.
On the daily chart, Disney is advancing within a motive structure and currently in wave (3) of C. The impulse behavior supports continued upward momentum, likely extending into wave 5 towards the top of MinorGroup1.
On the 1-hour chart, a more conservative wave count is suggested, implying the final stages of wave {v} of 5. This could signal an approaching top and a brief correction. Nonetheless, the primary trend remains positive.
Technical Analyst: Alessio Barretta
More By This Author:
Unlocking ASX Trading Success: Mineral Resources
Elliott Wave Technical Analysis: British Pound/U.S. Dollar - Tuesday, June 17
Elliott Wave Technical Analysis: Shanghai Composite Index - Tuesday, June 17
At TradingLounge™, we provide actionable Elliott Wave analysis across over 200 markets. Access live chat rooms, advanced AI & algorithmic charting tools, and curated trade ...
more

