
U.S. Stocks Nvidia Corp.
NVDA Elliott Wave Analysis – Trading Lounge
Nvidia Corp. (NVDA) – Daily Chart
NVDA Elliott Wave Technical Analysis
FUNCTION: Trend
MODE: Impulsive
STRUCTURE: Motive
POSITION: Wave (iii)
DIRECTION: Upside in (iii)
DETAILS: The current Elliott Wave count suggests Nvidia is in wave (iii) of an impulsive structure. Prices are trading in the upper range of MinorGroup2 near $180. There is potential for further upside toward TradingLevel2 at $200 before wave (iii) peaks. Traders should remain alert to signs of a top forming, as the wave continues to stretch higher.

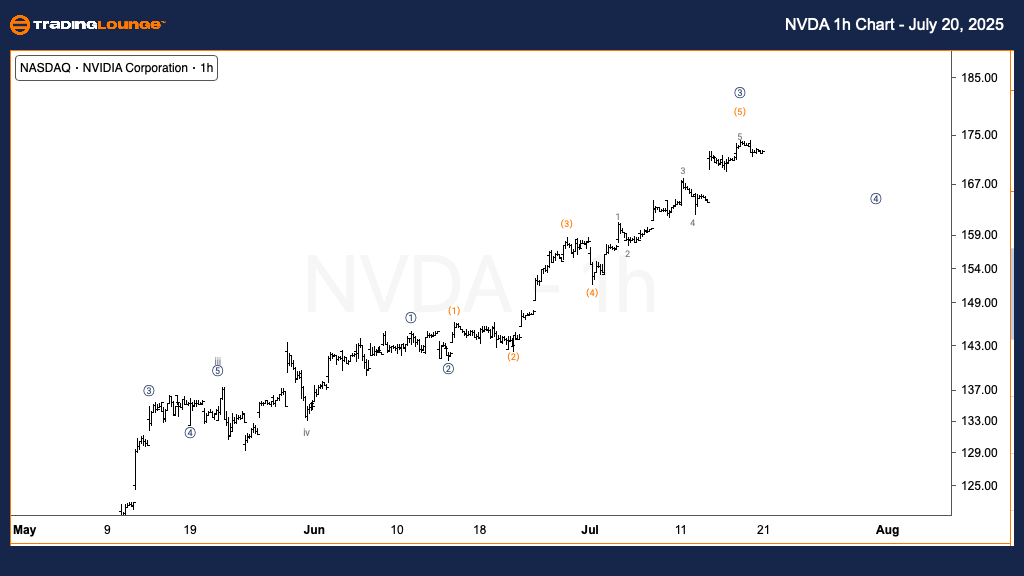
Nvidia Corp. (NVDA) – 1H Chart
NVDA Elliott Wave Technical Analysis
FUNCTION: Trend
MODE: Impulsive
STRUCTURE: Motive
POSITION: Micro Wave 3
DIRECTION: Top in Wave 3
DETAILS: On the 1-hour timeframe, NVDA is advancing through micro wave 3, nearing a possible end. The internal subdivisions suggest subminuette wave iv has completed, and a minor pullback in micro wave 4 could soon unfold. This would precede a final push higher in micro wave 5, which should complete the broader wave (iii). Watch for a brief consolidation followed by renewed upward movement as NVDA nears a resistance zone around $200.
This combined analysis provides a multi-timeframe view of Nvidia Corp. (NVDA) using Elliott Wave Theory. It outlines both the medium-term and intraday structures, helping traders align their strategies with key wave milestones.
Technical Analyst: Alessio Barretta
More By This Author:
Elliott Wave Technical Analysis: New Zealand Dollar/U.S. Dollar - Monday, July 21
ASX Trading: BHP Group Ltd. Analysis & Forecast, July 21
Russell 2000 Index - Elliott Wave Technical Analysis
At TradingLounge™, we provide actionable Elliott Wave analysis across over 200 markets. Access live chat rooms, advanced AI & algorithmic charting tools, and curated trade ...
more

