
U.S. Stocks: IonQ, Inc.
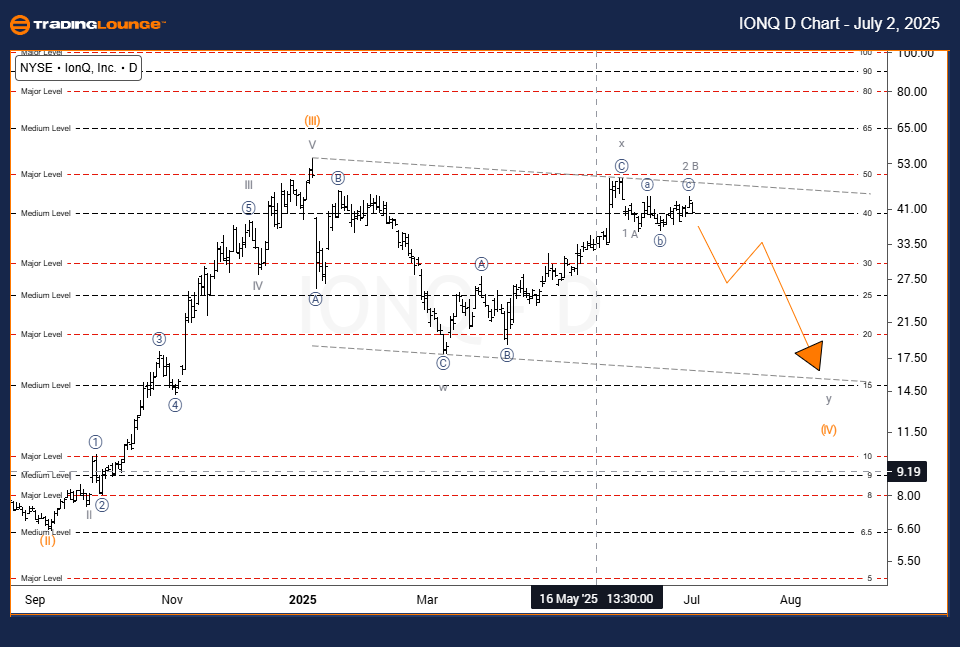
IonQ, Inc. (IONQ) – Elliott Wave Analysis (Daily Chart)
Technical Analysis Overview – Trading Lounge
FUNCTION: Counter Trend
MODE: Corrective
STRUCTURE: Corrective
POSITION: Wave A of y
DIRECTION: Downside in Wave C
DETAILS: Price targeting $25 and then $20 as Wave C nears completion
In the daily timeframe, IonQ, Inc. (IONQ) is advancing through the final stages of its corrective structure. Wave C, within Wave y, is leading the price toward the $25 level, and potentially to $20. This movement suggests the conclusion of a larger corrective phase may be near. As Wave B finishes, a decline in Wave C is likely to follow, setting up a possible short-term bearish opportunity.
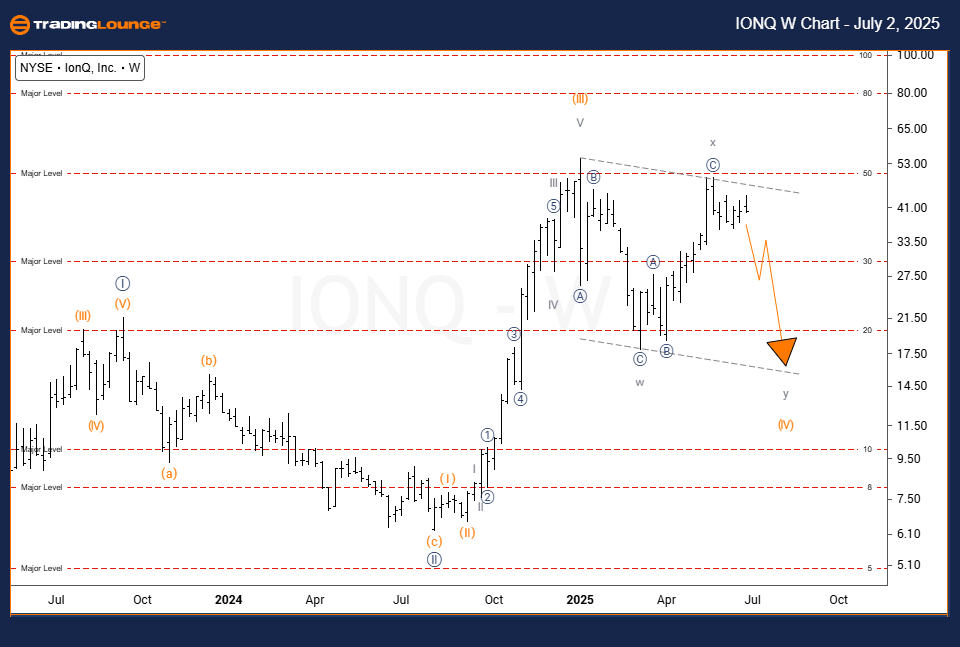
IonQ, Inc. (IONQ) – Elliott Wave Analysis (Weekly Chart)
Technical Analysis Overview – Trading Lounge
FUNCTION: Counter Trend
MODE: Corrective
STRUCTURE: Corrective
POSITION: Wave y of (IV)
DIRECTION: Downside into Wave y
DETAILS: Wave y has reached 100% of Wave w’s length, indicating maturity
The weekly chart for IonQ shows a mature corrective structure forming as Wave y of Wave (IV) nears completion. The stock has achieved a price extension equaling 100% of Wave w, a common threshold signaling a possible end to the correction. While the overarching trend remains bullish, this area could mark a short-term bottom. Traders should monitor price behavior for potential support and signs of a new impulse move.
Technical Analyst: Dhiren Pahuja
More By This Author:
Unlocking ASX Trading Success: Mineral Resources - Wednesday, July 2
Elliott Wave Analysis: British Pound/U.S. Dollar - Wednesday, July 2
Elliott Wave Technical Analysis TASI Index - Wednesday, July 2
At TradingLounge™, we provide actionable Elliott Wave analysis across over 200 markets. Access live chat rooms, advanced AI & algorithmic charting tools, and curated trade ...
more

