
TASI INDEX – Elliott Wave Analysis (Daily Chart)
Technical Analysis Overview – Trading Lounge
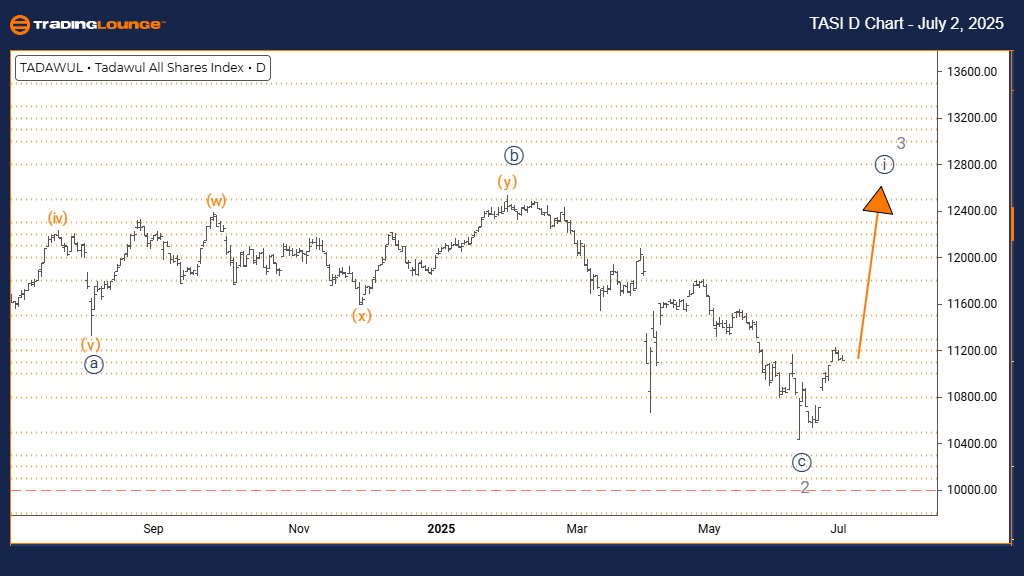
FUNCTION: Bullish Trend
MODE: Impulsive
STRUCTURE: Navy Blue Wave 1
POSITION: Gray Wave 3
NEXT LOWER DEGREE DIRECTION: Navy Blue Wave 2
DETAILS: Gray Wave 2 appears complete. Navy Blue Wave 1 of 3 is now in play.
The daily chart analysis of the TASI INDEX reveals a bullish outlook. Price action is currently moving impulsively, marking the early phase of a larger upward trend. The wave count identifies Navy Blue Wave 1, which is part of the broader Gray Wave 3, now underway. This suggests a new bullish sequence has begun.
Following the completion of Gray Wave 2, the market has likely transitioned into Navy Blue Wave 1 of 3. This signals the beginning of a new impulsive wave, indicating a strong directional move. After this wave completes, a correction (Navy Blue Wave 2) is anticipated before resuming the upward trend.
Current technical indicators point to continued bullish momentum, with strong buying interest supporting the move. The index appears well-positioned for further gains within the ongoing Gray Wave 3 advance.
TASI INDEX – Elliott Wave Analysis (Weekly Chart)
Technical Analysis Overview – Trading Lounge
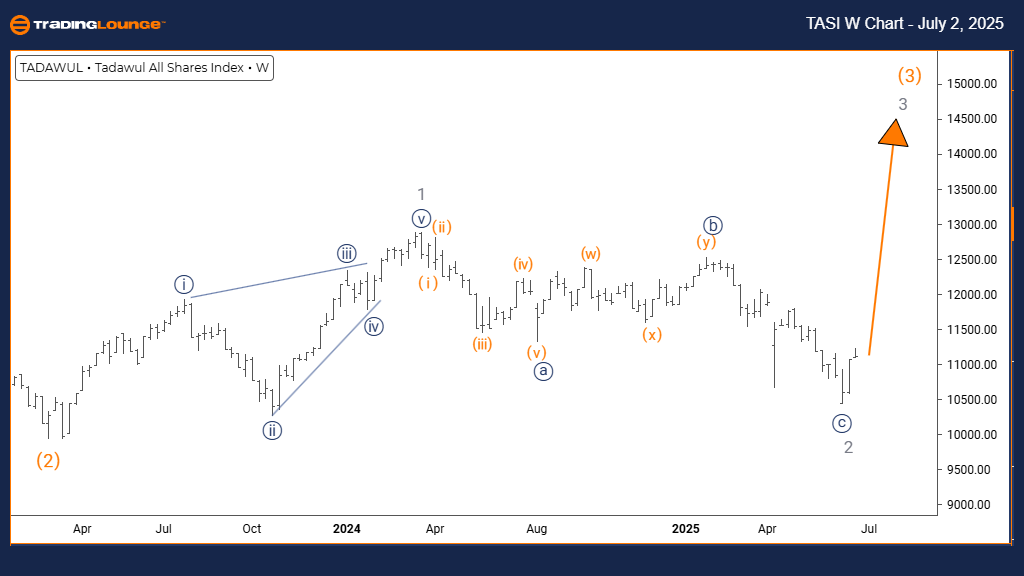
FUNCTION: Bullish Trend
MODE: Impulsive
STRUCTURE: Gray Wave 3
POSITION: Orange Wave 3
NEXT HIGHER DEGREE DIRECTION: Gray Wave 3 (In Progress)
DETAILS: Gray Wave 2 seems complete. Gray Wave 3 of Orange Wave 3 is unfolding.
On the weekly chart, the TASI INDEX remains in a strong bullish phase. The structure identifies Gray Wave 3 developing within the broader Orange Wave 3, typically known for extended price rallies. The impulsive mode and positioning suggest the index is in its most dynamic growth stage.
With Gray Wave 2 concluded, the current action signals the onset of Gray Wave 3 of 3 – often the strongest portion of any Elliott Wave sequence. This phase is usually characterized by strong buying momentum and fewer retracements.
The technical framework supports sustained growth, with the potential for significant gains as Gray Wave 3 continues to unfold in the coming weeks.
Technical Analyst: Malik Awais
More By This Author:
Indian Stocks - Mahindra & Mahindra
Elliott Wave Technical Analysis: Theta Token Crypto Price News For Wednesday, July 2
Unlocking ASX Trading Success: Northern Star Resources


Comments
Log in or sign up to join the conversation.