

Image Source: Pexels
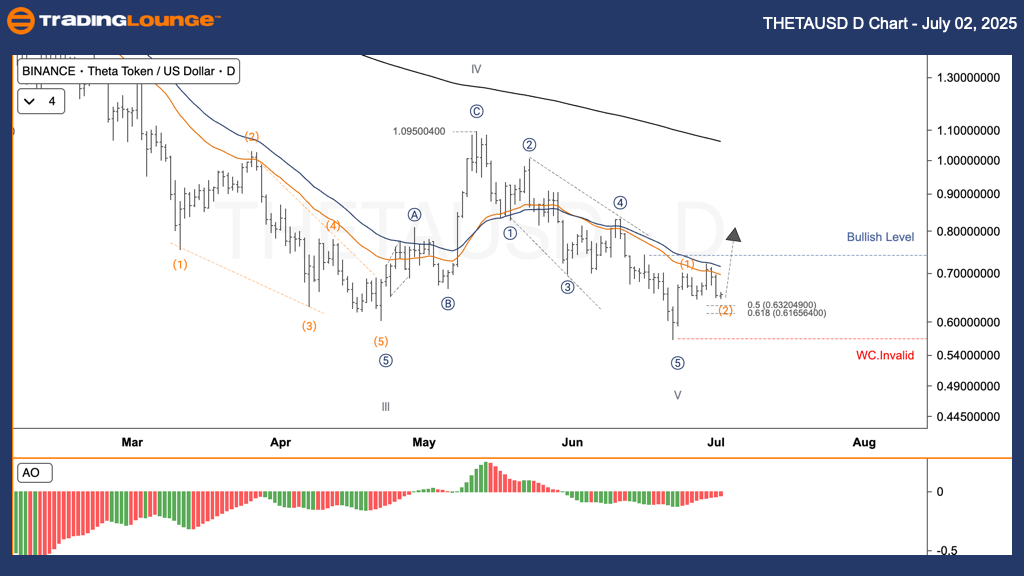
THETAUSD – Elliott Wave Technical Analysis (Daily Chart)
- Function: Follow Trend
- Mode: Motive
- Structure: Impulse
- Position: Wave 5
- Next Direction: Higher Degrees
- Invalidation Level: Not specified
Market Overview:
Theta Token (THETAUSD) recently completed a major bearish trend and reached a new low. It now appears to be entering a recovery phase, showing signs of a new upward wave structure. Currently, the token is consolidating in wave (2) and has potential to accelerate into wave (3).
Trading Strategy:
✅ For Short-Term Traders (Swing Trade):
- Buy Zone: Watch for opportunities to buy on a dip near the 0.6200 USD level.
- 🟥 Stop Loss: Place a stop-loss below the 0.5600 USD mark to manage downside risk.
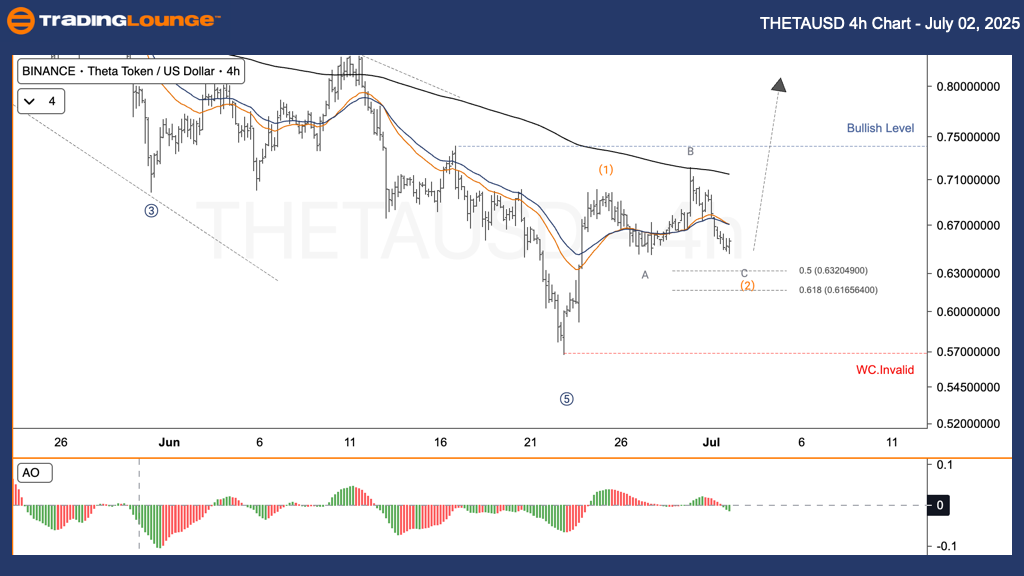
THETAUSD – Elliott Wave Technical Analysis (4-Hour Chart)
- Function: Follow Trend
- Mode: Motive
- Structure: Impulse
- Position: Wave 5
- Next Direction: Higher Degrees
- Invalidation Level: Not specified
Market Overview:
Similar to the daily chart, the 4-hour chart confirms that THETAUSD may have concluded a significant downward correction. The price is now forming wave (2), creating a base from which wave (3) might begin to rise.
Trading Strategy:
✅ For Short-Term Traders (Swing Trade):
- Buy Zone: Look to buy on a dip around 0.6200 USD.
- 🟥 Stop Loss: Implement risk controls with a stop-loss set below 0.5600 USD.
Analyst: Kittiampon Somboonsod, CEWA
Source: TradingLounge.com
More By This Author:
Unlocking ASX Trading Success: Northern Star Resources
Elliott Wave Technical Analysis: Australian Dollar/Japanese Yen - Tuesday, July 1
Elliott Wave Technical Analysis: Shanghai Composite Index - Tuesday, July 1


Comments
Log in or sign up to join the conversation.