
U.S. Stocks Fortinet Inc.
FTNT Elliott Wave Analysis – TradingLounge Daily & 1H Charts
Fortinet Inc. (FTNT) – Daily Chart Overview
Elliott Wave Technical Analysis
Function: Trend
Mode: Impulsive
Structure: Motive
Position: Wave 1 of (5)
Direction: Upside in Wave 1
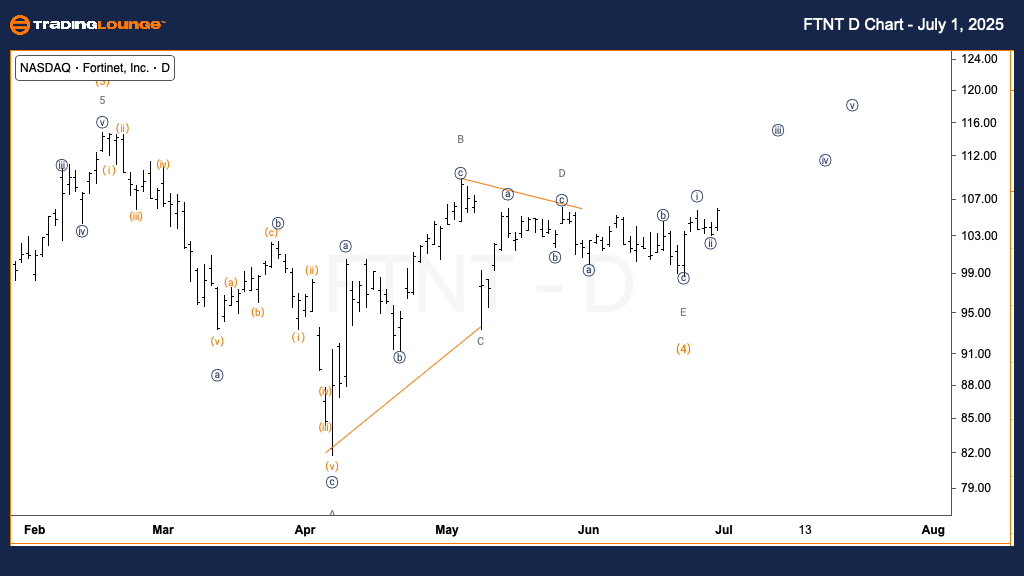
Details: Wave (4) appears to have completed within a triangle pattern. With price support above $100, the next move is likely upward continuation in Wave 1.
Fortinet Inc. is showing signs of entering a new bullish phase on the daily chart. Following the completion of Wave (4), which formed as a triangle, the market has found a technical base for Wave (5) to begin. With strong support holding above the $100 level, price action is aligned with the development of Wave 1 of (5), reinforcing the overall bullish outlook.
Fortinet Inc. (FTNT) – 1-Hour Chart Overview
Elliott Wave Technical Analysis
Function: Trend
Mode: Impulsive
Structure: Motive
Position: Wave {iii} of 1
Direction: Acceleration in Wave {iii}
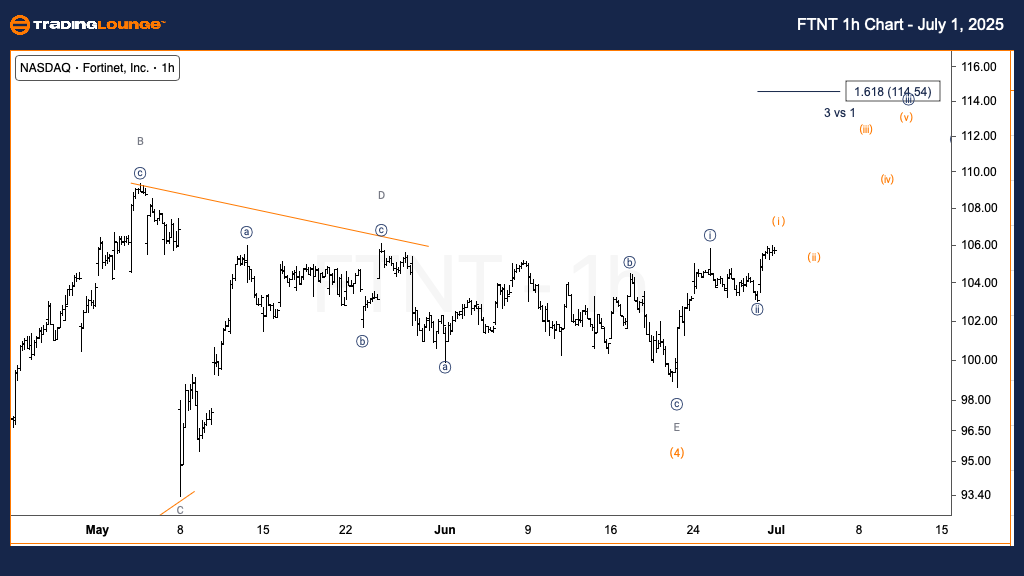
Details: Wave {ii} appears complete. A minor pullback in Wave (ii) of {iii} may occur before continued upward movement.
The 1-hour chart supports the broader trend with a confirmed progression into Wave {iii} of 1. After concluding Wave {ii}, price action indicates a potential short-term correction within Wave (ii) of {iii}. Despite this, the dominant trend remains bullish, with upside acceleration likely as the impulsive sequence unfolds.
Technical Analyst: Alessio Barretta
More By This Author:
Unlocking ASX Trading Success: Northern Star Resources
Elliott Wave Technical Analysis: Shanghai Composite Index - Tuesday, July 1
Elliott Wave Technical Analysis: Binance Crypto Price News For Tuesday, July 1
At TradingLounge™, we provide actionable Elliott Wave analysis across over 200 markets. Access live chat rooms, advanced AI & algorithmic charting tools, and curated trade ...
more

