
U.S. Stocks: Costco Wholesale Corp.
COST Elliott Wave Analysis – Trading Lounge Daily Chart
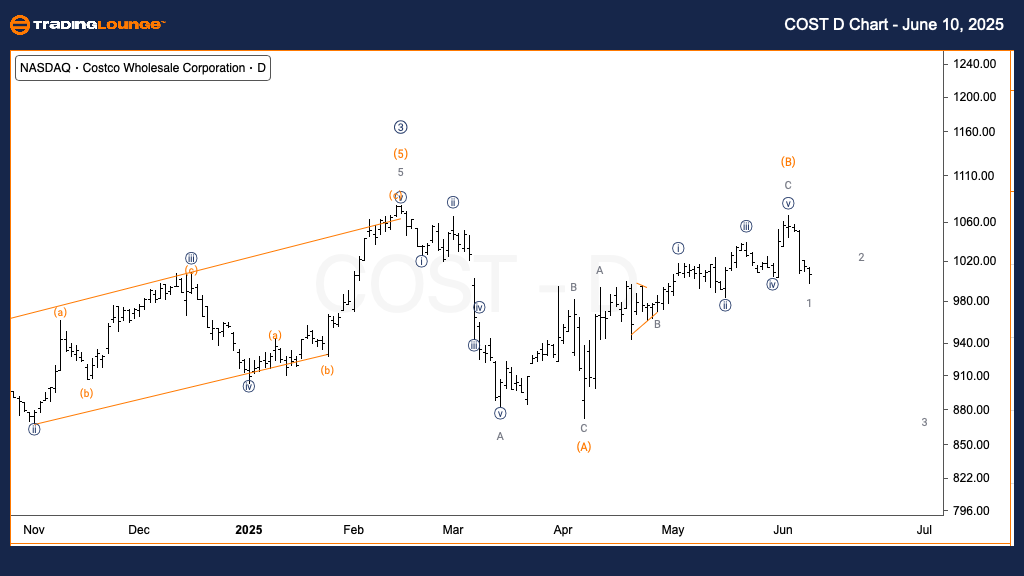
Costco Wholesale Corp. (COST) – Daily Chart
COST Elliott Wave Technical Analysis
FUNCTION: Counter Trend
MODE: Corrective
STRUCTURE: Flat
POSITION: Wave 2 of (C)
DIRECTION: Downside in Wave 2
DETAILS: The current setup shows a potential pullback into Wave 2 of (C) after a bounce from TradingLevel1 at $1000. The bearish outlook remains uncertain unless $1000 is confirmed as resistance through retest. Deeper retracement in Wave 2 is possible before any move towards Wave 3 of (C).
(Click on image to enlarge)
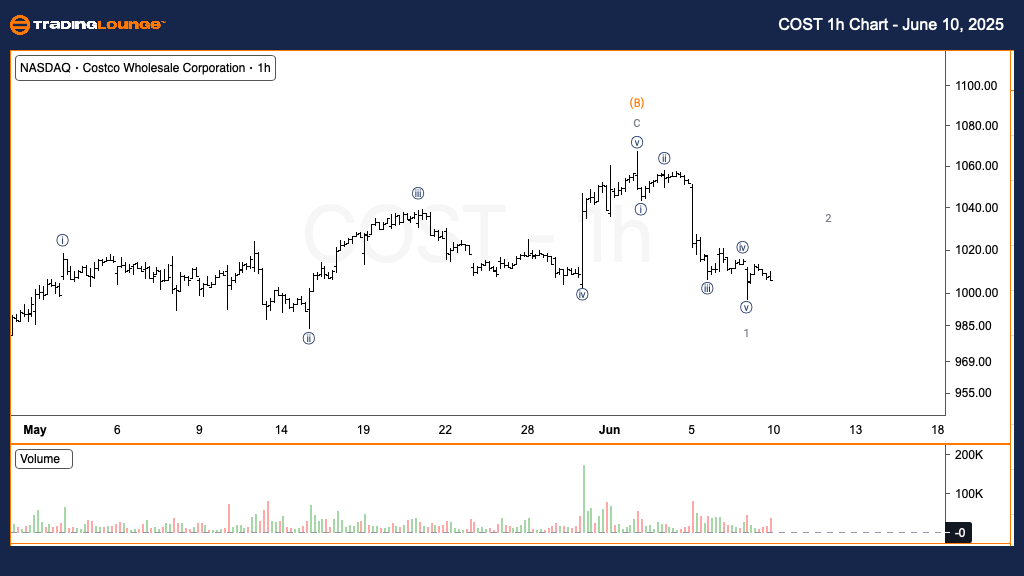
Costco Wholesale Corp. (COST) – 1H Chart
COST Elliott Wave Technical Analysis
FUNCTION: Counter Trend
MODE: Corrective
STRUCTURE: Flat
POSITION: Wave {a} of 2
DIRECTION: Upside in Wave 2
DETAILS: The chart indicates a completed five-wave decline into Minor Wave 1, which signals the beginning of a corrective rally as part of Wave 2. Wave {a} is currently progressing to the upside. Once Wave 2 completes, expect a continuation downward with another five-wave impulsive structure.
Combined Technical Summary:
This Elliott Wave analysis combines both the daily and 1-hour charts to offer a clearer view of Costco Wholesale Corp.'s (COST) current technical outlook:
- Daily Chart: Suggests a corrective pullback in Wave 2 of (C) following a bounce from the key level of $1000.
- 1H Chart: Indicates the development of a counter trend rally (Wave {a} of 2) after a confirmed five-wave decline into Minor Wave 1.
Technical Analyst: Alessio Barretta
More By This Author:
Unlocking ASX Trading Success: Northern Star Resources Ltd - Tuesday, June 10
Elliott Wave Technical Analysis: Hang Seng Index - Tuesday, June 10
Elliott Wave Technical Analysis: Euro/British Pound - Tuesday, June 10
At TradingLounge™, we provide actionable Elliott Wave analysis across over 200 markets. Access live chat rooms, advanced AI & algorithmic charting tools, and curated trade ...
more

