
U.S. Stocks Caterpillar Inc.
Caterpillar Inc. (CAT) – Elliott Wave Analysis (Daily Chart)
Technical Analysis Overview – Trading Lounge
FUNCTION: Trend
MODE: Motive
STRUCTURE: Impulsive
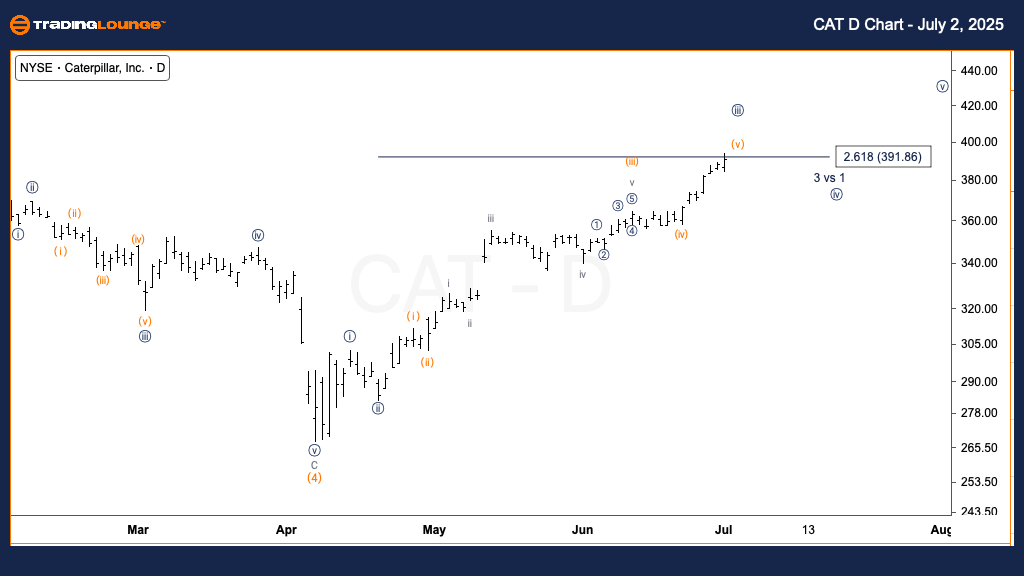
POSITION: Wave {iii} of 1
DIRECTION: Upside into Wave {iii}
DETAILS: Wave {iii} appears mature, extending 2.618x the length of Wave {i}
On the daily chart, Caterpillar Inc. (CAT) is in a continued uptrend within a strong impulsive wave structure. The stock is progressing through Wave {iii} of Wave 1, with prices reaching approximately 2.618 times the length of Wave {i}. This ratio often signals the peak of Wave {iii}, suggesting a potential short-term top. While the broader uptrend remains firm, traders should watch for resistance and signs of consolidation before the next wave unfolds.
Caterpillar Inc. (CAT) – Elliott Wave Analysis (1-Hour Chart)
Technical Analysis Overview – Trading Lounge
FUNCTION: Trend
MODE: Motive
STRUCTURE: Impulsive
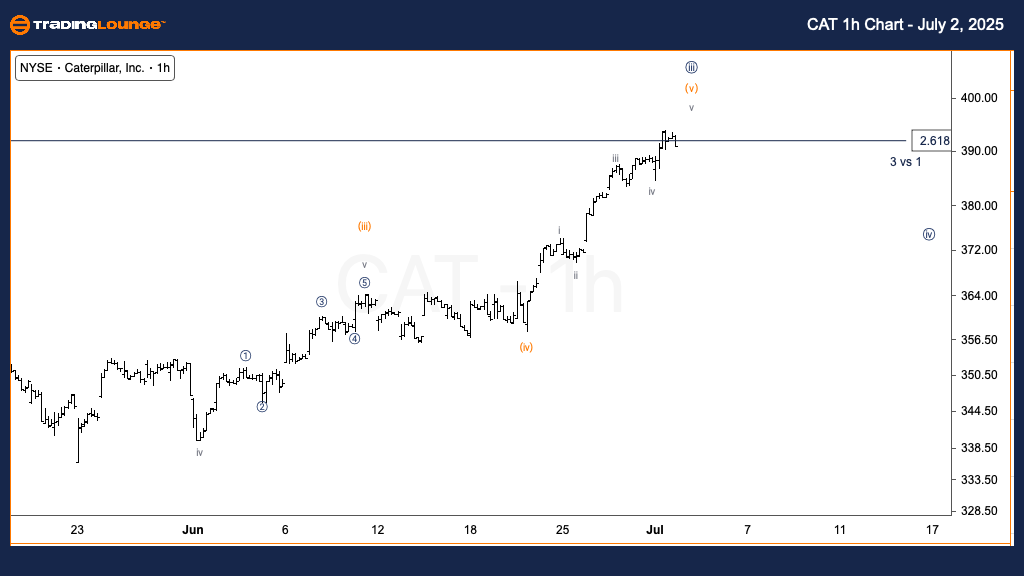
POSITION: Wave (v) of {iii}
DIRECTION: Upside in Wave (v)
DETAILS: Price advancing toward $400, nearing end of Wave (v)
On the 1-hour timeframe, CAT continues its upward move, completing the final stages of Wave (v) within Wave {iii}. The stock is approaching the $400 level, indicating that the current impulse may soon complete. As Wave (v) concludes, a short-term pullback in Wave {iv} is expected, potentially offering a tactical entry for those aligning with the broader bullish structure. Monitoring intraday exhaustion signals will be key for timing any position adjustments.
Technical Analyst: Alessio Barretta
More By This Author:
Unlocking ASX Trading Success: Mineral Resources - Wednesday, July 2
Elliott Wave Analysis: British Pound/U.S. Dollar - Wednesday, July 2
Elliott Wave Technical Analysis TASI Index - Wednesday, July 2
At TradingLounge™, we provide actionable Elliott Wave analysis across over 200 markets. Access live chat rooms, advanced AI & algorithmic charting tools, and curated trade ...
more

