

Image Source: Pixabay
SPX Monitoring purposes; Sold long 9/13/24 at 5626.02= gain 2.23%; Long SPX on 9/5/24 at 5503.41.
Sold SPX on 8/19/24 at 5608.25 = Gain 8.14%gain; Long SPX on 8/5/24 at 5186.33.
Our Gain 1/1/23 to 12/31/23 SPX= 28.12%; SPX gain 23.38%
Monitoring purposes GOLD: Long GDX on 10/9/20 at 40.78.
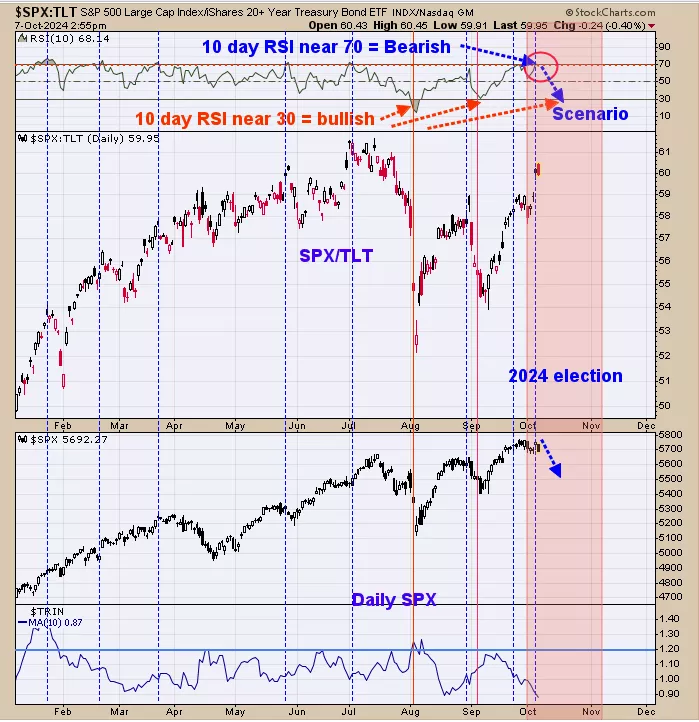
We are up over 28% this year so far; SPX up around 20%. Above is the SPX/TLT ratio with its RSI (top window) and the 10 day TRIN (bottom window).The RSI for the SPX/TLT ratio reached the bearish level for the SPX near 70 in late September (noted with blue dotted lines) and again currently suggesting upside for the market was limited and a pull back in the market was likely. Ideally we would like to see the RSI reach near 30 for a bullish setup going into the 2024 Election. Both previous Elections lows in 2016 and 2020 produced RSI near 30 (see last Thursday’s report) and it’s likely this time around.
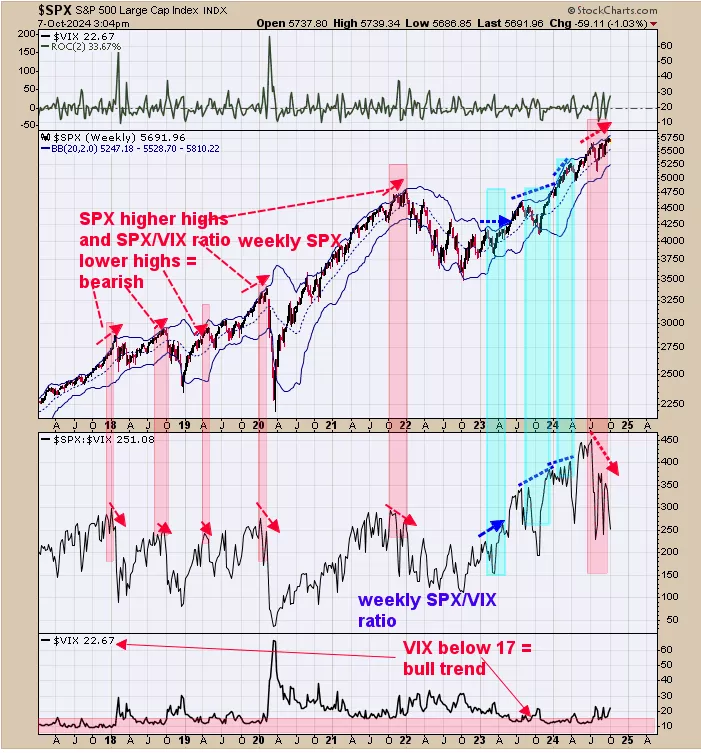
Above is the weekly SPX/VIX ratio; second window up form the bottom and next higher window is the SPX. A bearish divergence is present when the SPX makes higher highs and the SPX/VIX ratio makes lower high (noted in shaded pink). The current negative divergence has been present since mid July.This bearish indicator goes along with the bearish RSI near 70 for the SPX/TLT ratio on page one.We also noticed that the NYSE Summation index closed above +1000 on 9/30 (note shown) showing underlining strength in the market and suggests the potential pull back may be mild. A worthwhile low may form later this month and most likely before the Election announcement.
(Click on image to enlarge)
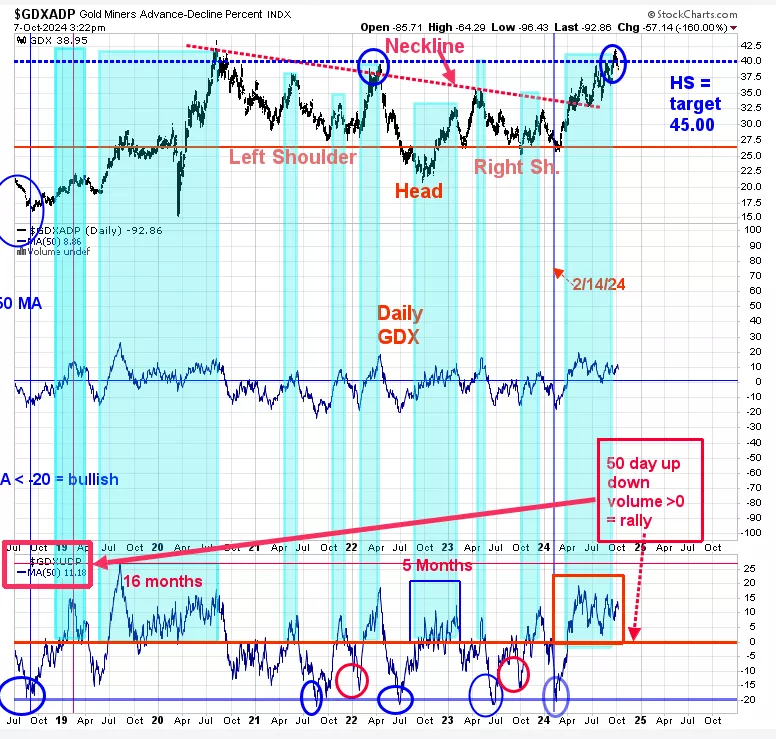
The bottom window is the GDX 50 day average of the up down volume percent. GDX is considered in a bullish mode when this indicator is above “0” (current reading is +11.18).We noted previous times when this indicator was above “0” shaded in light green. Notice that GDX is currently testing the early 2022 and 2020 highs near 40.00 and not backing away. This conditions is suggesting GDX is absorbing supply and a bullish sign.
More By This Author:
Bearish For The Short Term
New Highs Later This Year
The All New Market Analysis


Comments
Log in or sign up to join the conversation.