
It’s a modestly negative tone this morning as S&P 500 futures trade down 0.2% and the Nasdaq is down slightly less. Headline writers are attributing the weakness to concerns over a government shutdown, but those fears didn’t seem to bother anyone yesterday. Maybe it’s just Tuesday (see below). Treasury yields are slightly higher, crude oil is down nearly 1%, gold and other precious metals are lower across the board, as is crypto.
Overnight, Asian stocks were mostly lower. Japan traded down 0.3% as market expectations for a rate hike increase, and the government raised its forecasts for consumer spending for the first time in over a year. PMI data in China was mixed, with the manufacturing component coming in slightly ahead of forecasts (but still below 50) while the services index missed expectations.In Europe, most major indices are little changed as economic data in Germany (Retail Sales) and France (CPI) missed expectations.
In the US today, we’ll get the Chicago PMI, which always seems to disappoint, at 9:45 followed by JOLTS and Consumer Confidence at 10 AM. The only earnings report of note is Nike (NKE) after the close.
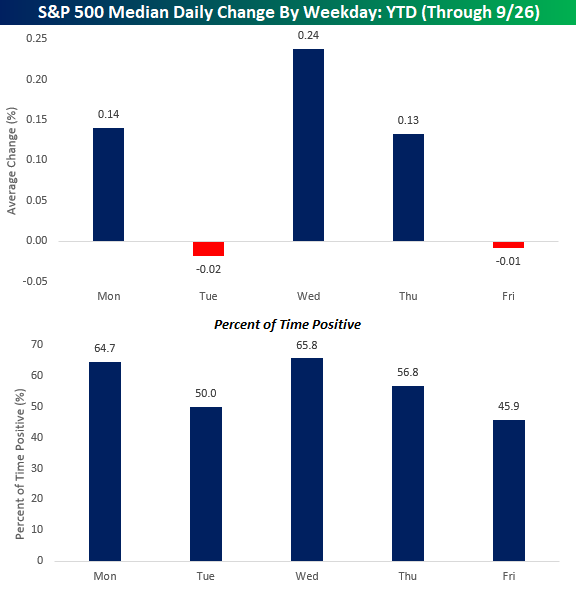
What’s so bad about Monday anyway? Lately, not much. The S&P 500 rallied 0.26% yesterday for its fourth straight positive start to the week and continuing a trend that has been in place for most of the year. Through last Friday, Mondays have been the second most positive weekday of the year with a median gain of 0.14% and gains 64.7% of the time. The only day of the week that has been stronger this year is Wednesday, with its median gain of 0.24% and gains 65.8% of the time.
While Mondays have been strong, Tuesday is the new Monday as it ranks as the weakest weekday of the year with a median decline of 0.2% this year and gains just half of the time. The only other day of the week that has experienced negative returns on a median basis this year is Friday. So, maybe it shouldn’t come as any surprise that futures are lower this morning.
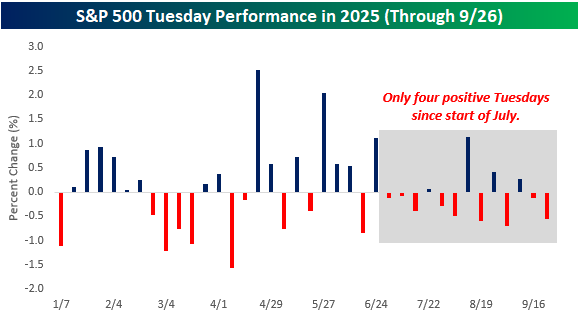
Looking at Tuesday performance more closely, the third quarter has been especially weak. Since the start of July, only four of the twelve Tuesdays have seen gains, so if the S&P 500 can manage to squeeze out a gain today, it would break what has been a pretty consistent trend of recent weakness.
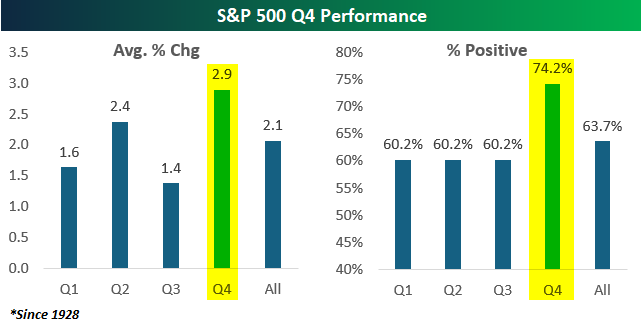
Today marks the last trading day of Q3, which has historically been the weakest quarter of the year. Since 1928, the S&P 500’s average performance during Q3 has been a gain of 1.4% with positive returns 60.2% of the time, but returns in Q4 have been better than and more consistent to the upside with an average gain of 2.9% and gains just under three-quarters of the time. For more analysis on quarterly seasonality, make sure to check out Monday’s Chart of the Day.
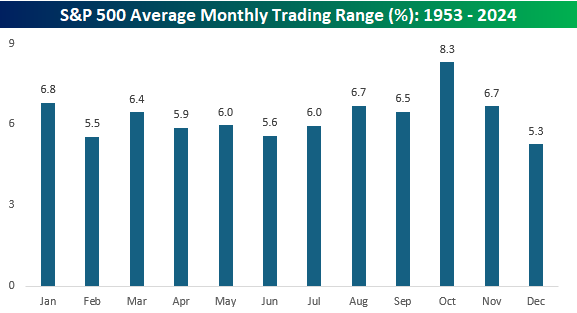
While Q4 has historically been strong, buckle up for some volatility. The chart below shows the average monthly trading range of the S&P 500 since 1953 (when the five-day trading week in its current form started). October’s average high-low spread (%) has been 8.3% which far surpasses the average monthly range of any other month. The next closest month is January at 6.8%. What’s notable about the 1.5 percentage point spread between the most volatile and second most volatile months is that it’s also the same as the spread between the second most volatile (January) and the least volatile months (December).
More By This Author:
Home Sale StrengthInvestors Buying Apple As Consumers Buy The iPhone
Halfway Through September


Comments
Log in or sign up to join the conversation.