
Traders Betting Fed Funds Rate Will End 2023 At 3.63% Vs. Pre-SVB Expectations Of 5.38%
It is an FOMC week this week. Fed funds futures expect the one-year tightening cycle to terminate with a 25-basis-point hike this time; by June, the Fed is already expected to ease, with 2023 ending at 3.68 percent and 2024 at 2.88 percent. Whether or not the Fed goes along with this will reverberate through all kinds of assets, including equities.
The FOMC meets this week, with the two-day affair ending on Wednesday, and it will accompany a statement.
The Federal Reserve has hiked uninterrupted for a year – from a range of zero to 25 basis points in March last year to the current 450 basis points to 475 basis points.
By law, the central bank has a dual mandate of maximum employment and price stability. Over the years, financial stability by default has become its third mandate. On this front, the recent collapse of Silicon Valley Bank (SVB) and Signature Bank continues to reverberate through the banking sector in particular and the stock market in general. Stocks of community/regional banks are very volatile. First Republic bank, for instance, went from $123.45 two weeks ago to last Monday’s low of $17.53; on Thursday, the stock stabilized after 11 other large banks pledged to deposit $30 billion in the bank, but come Friday, it again lost 32.8 percent to $23.03.
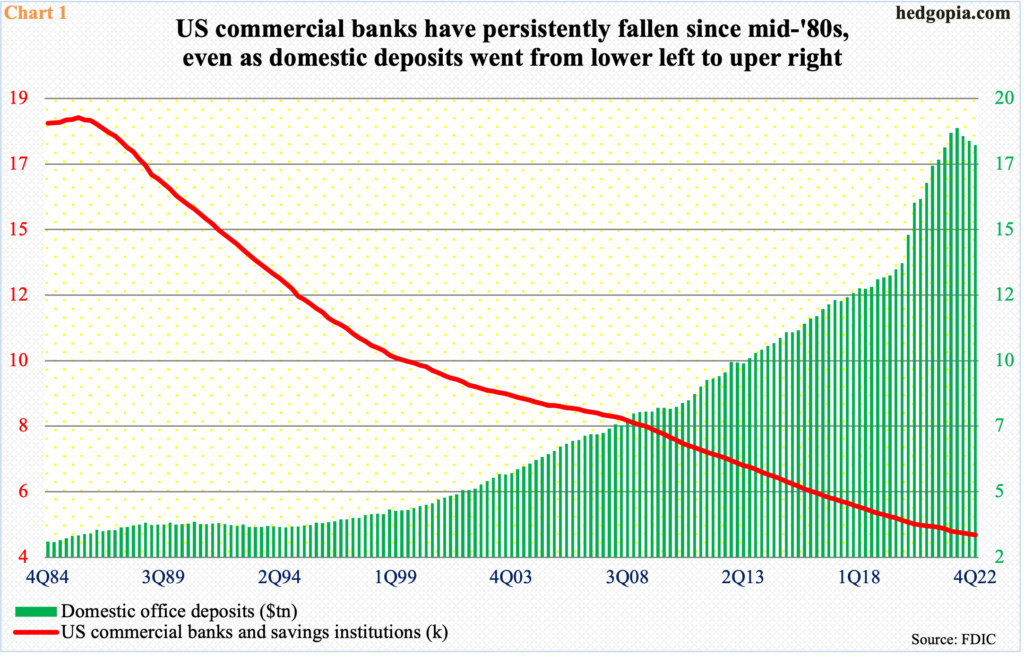
Over the past four decades, the number of US banks has consistently gone from the top left to the bottom right (Chart 1). In 1Q86, their count peaked at 18,083, which by 4Q22 had shrunk to 4,706. This is still a big number and is primarily made up of regional and community banks.
Of the 4,706, as of 4Q22, only 20 held assets north of $200 billion, including the failed Silicon Valley Bank ($209 billion) and the big four – JP Morgan ($3.2 trillion), Bank of America ($2.4 trillion), Citibank ($1.8 trillion) and Wells Fargo ($1.7 trillion). Fourteen were between $100 billion and $200 billion, and 16 were between $50 billion and $100 billion. A whopping 4,656 were under $50 billion, comprised of 3,725 under a billion and 761 under $100 million. Altogether, these banks held $23.6 trillion in assets and $17.7 trillion in domestic deposits. This compares with $26.1 trillion in nominal GDP in 4Q22.
Given the changed circumstances post-SVB collapse and the resulting investor angst, the Fed essentially has two choices – hike by 25 basis points or stay pat. Both come with a cost.
Not hiking now can potentially send a message that not all is well. It can also be interpreted as running counter to the Fed’s inflation-fighting commitment. Directionally, consumer inflation is headed in the right direction but remains elevated.
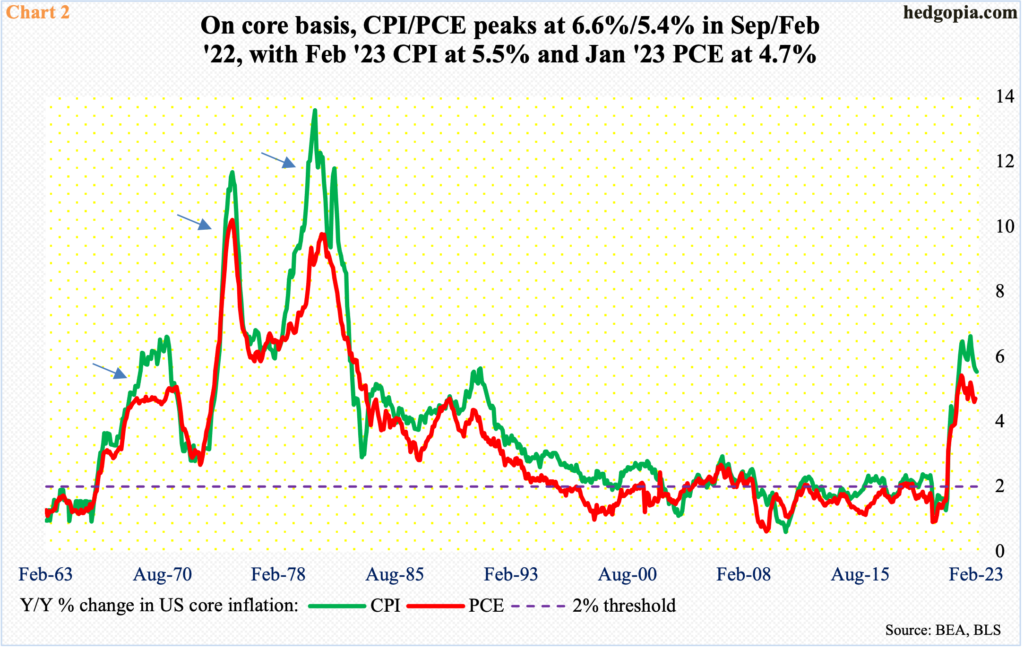
In the 12 months to February, headline and core CPI – out last Tuesday – rose six percent and 5.5 percent respectively. They peaked last year at 9.1 percent in June and 6.6 percent in September, in that order (chart here). Core CPI is well ahead of the central bank’s two percent objective. As well, core PCE, which is the Fed’s favorite, increased 4.7 percent year-over-year in January, although it too is down from the February 2022 peak of 5.4 percent (Chart 2).
Staying with hiking keeps the tightening cycle alive but at this point only a 25 is probable. Until recently, futures traders were pricing in a 50-basis-point raise this week. The SVB developments hurriedly changed that outlook. There was a point early last week that these traders were expecting no hike at all, in line with Goldman Sachs’ forecast. Now, they are betting on a 25, which is what the Fed is likely to do.
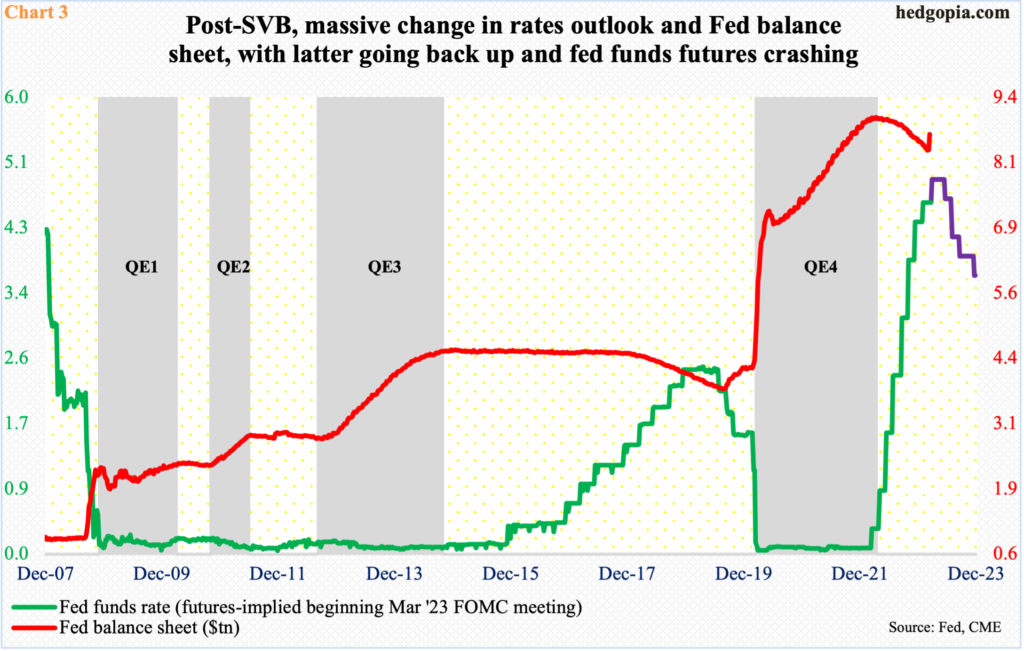
More important is the statement, which is published every three months, and the dot plot. As things stand, March will be the last time the Fed is expected to raise the benchmark rates – to a range of 475 basis points to 500 basis points. In fact, the futures market is betting that the rates will be lowered in June, ending 2023 at 350 basis points to 375 basis points (Chart 3). Pre-SVB, 2023 was expected to end between 525 basis points and 550 basis points. A year later – by Dec 2024 – rates are expected to go down another 75 basis points to between 275 basis points and 300 basis points.
The question is, will the Fed go along with this and give what the market wants?
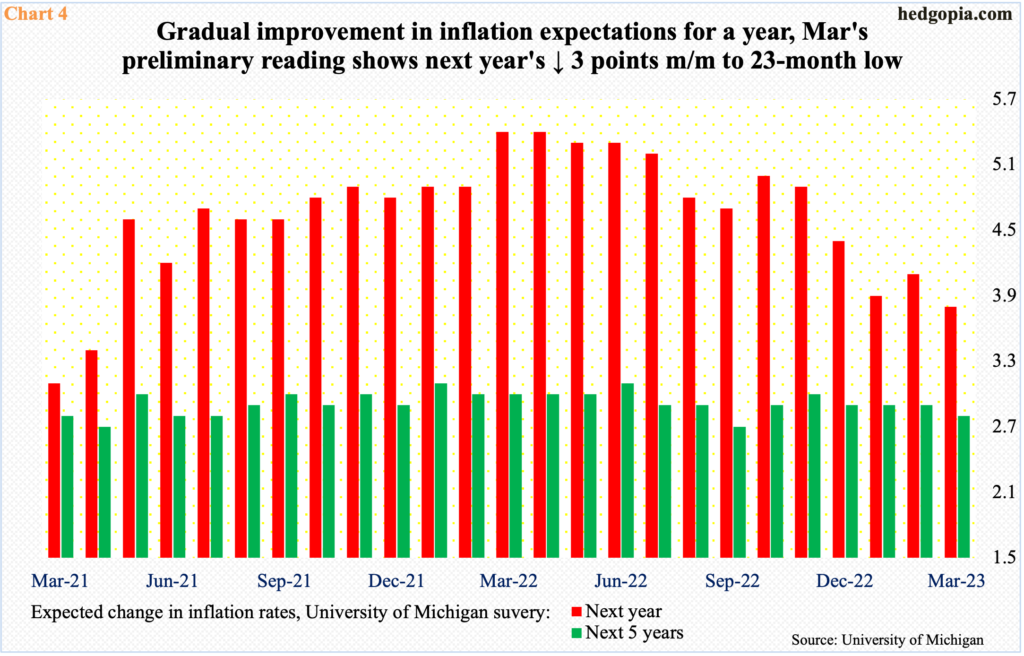
Of note, March’s preliminary data showed inflation expectations for next year decreased to 3.8 percent from February’s 4.1 percent. This was the lowest reading since April 2021. In March and April last year, this was as elevated as 5.4 percent (Chart 4).
The trend is decidedly down, and this is also the case with expectations for the next five years. March was down one-tenth of a percentage point month-over-month to 2.8 percent, with the series having peaked at 3.1 percent last June.
A pause after this week’s hike can embolden equity bulls, which will then contribute to a loosening of financial conditions. The Fed, which is currently focused on its inflation mandate, has not been a fan of this. In the right circumstances, inflation can easily resurge. This was evident several times in the ’70s (arrows in Chart 2).
With this as a background, it should not come as a surprise that the S&P 500 is not sure which way it wants to go. Last week, it rose 1.4 percent. In the prior week, it tumbled 4.5 percent. Last week, the large cap index began with continued downward momentum as Monday was down 1.4 percent at the session lows but the low of 3809 was bought. By intraday Thursday, it was up 2.7 percent for the week, but the bulls were unable to hang on to all of it.
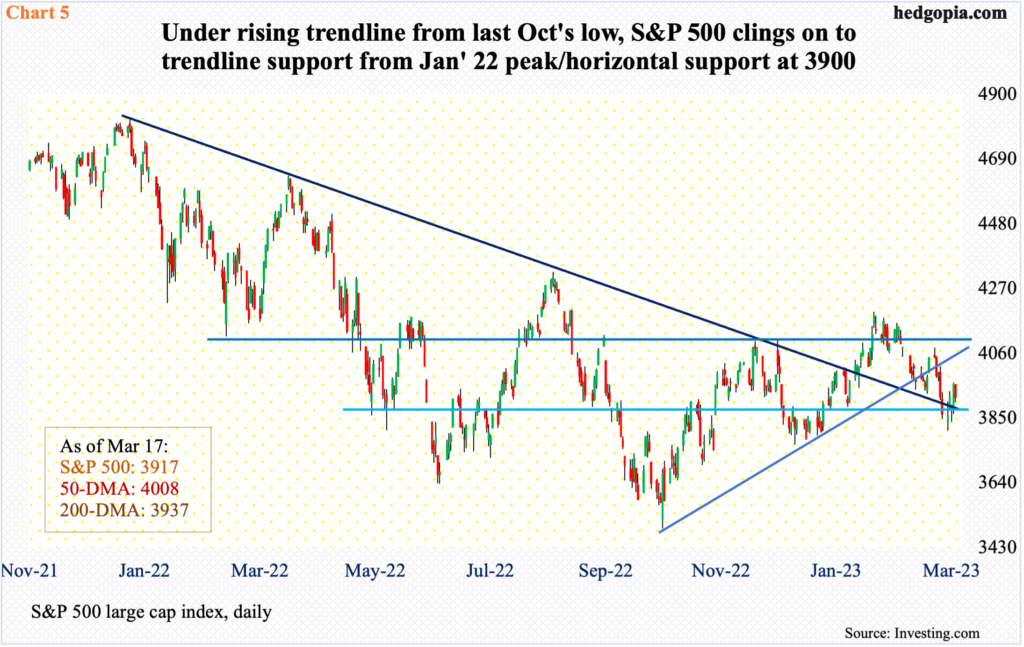
The S&P 500 has been under pressure since reversing on February 2 after tagging 4195. If Thursday’s low holds, it would have been down 9.2 percent from that high.
Technically, a rising trendline from last October’s low has been breached, but at the same time, the horizontal resistance at 3900 is intact, with the index closing last Friday just above it at 3917. This support currently coincides with trendline support from the January 2022 peak (Chart 5). Should 3900 not give way, bulls in due course have a shot at 4100; a decisive loss of 3900 bodes ill.
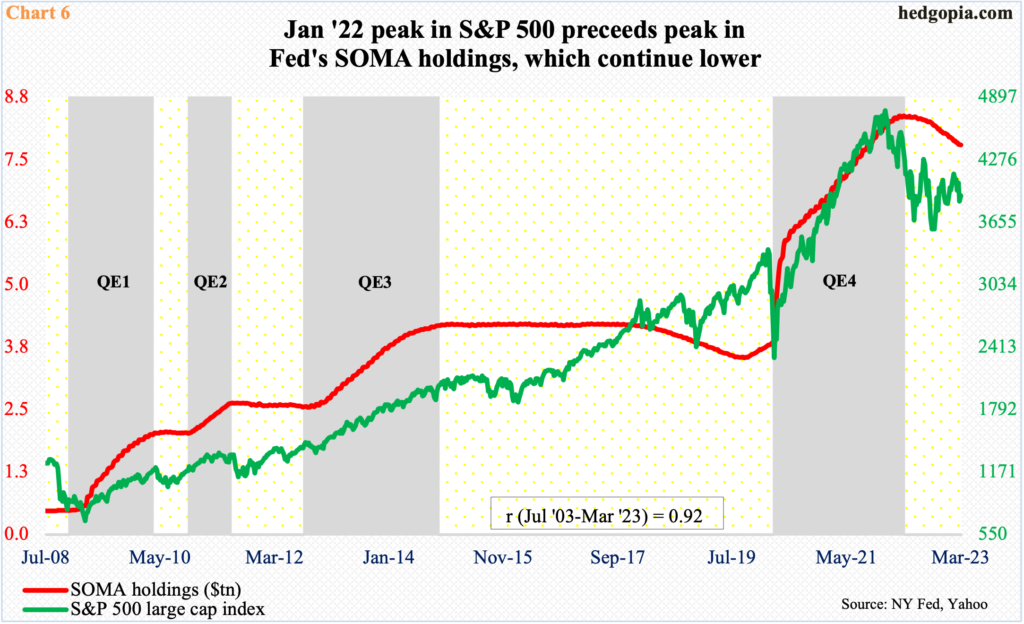
Where the S&P 500 goes from here can get influenced by how investors perceive if the Fed is quantitatively tightening or easing. Post-SVB, the Fed is doing both. In the week to last Wednesday, its balance sheet went up $297 billion week-over-week to $8.6 trillion (Chart 3); concurrently, SOMA (System Open Market Account) holdings were down $9.2 billion to $7.8 billion (Chart 6). The two tend to go hand in hand but diverged last week.
Historically, the S&P 500 has shown a strong tendency to move with SOMA holdings. In fact, going back to 2003, the coefficient correlation between the two is a strong 0.92. Hence the significance of how investors view the current divergence between these holdings and the balance sheet overall. If the divergence ends and they both go lower, stocks in the long run have struggled to thrive in a tighter liquidity situation, irrespective of the short-term trading opportunities.
More By This Author:
Sell-Side Earnings Estimates Continue To Brush Off Warnings From Treasury Yield Curve, Crude And Copper
No Washout In % Of S&P 500 Stocks Above 50-Day But Low Enough To Allow Rally In Index
Rising Rates To Reverberate Through Consumer Delinquency Rate At Some Point


