
Over the last few days, I’ve illustrated how several major indicators are flashing “RECESSION!”
By quick way of review:
- The 10y-3m yield curve has predicted every recession in the last 50 years. It’s telling us that a new, severe recession is just around the corner.
- Oil has collapsed from $130 per barrel to ~$75 per barrel, indicating demand destruction is underway. This only happens during a recession.
All of these data points are BAD news for stocks.
Why?
During the typical recession Earnings Per Share (EPS) decline by 25%.
Based on what bonds are doing, stocks are priced between 16 and 18 times forward EPS. And Wall Street is currently forecasting EPS growth of 5% next year to $230.
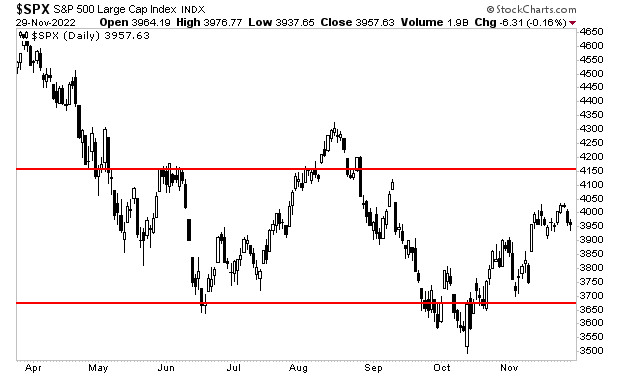
$230 X 16 (or 18)= 3,680 to 4,410.
Incidentally, that is the trading range that stocks have been in for most of the last six months.
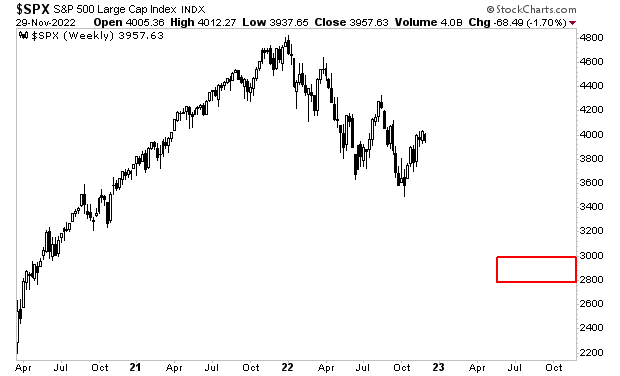
However, a recession would mean that EPS for 2023 is closer to $172.
$172 X 16 (or 18)= 2,752 to 3,096
That’s the red box in the chart below.
Put simply, a recession will erase trillions of dollars in wealth…and Wall Street is once again asleep at the wheel, driving its clients off a cliff.
More By This Author:
This Is Why We Opened Our Crash Trades
Forget Stocks, The Bond Market Is Signaling Something Major
The Fed Didn’t Pivot… And It Won’t For Months


Comments
Log in or sign up to join the conversation.