
This Firm Will Meet Tomorrow’s Healthcare Needs
Hospitals are currently facing the “triple whammy” of canceled elective procedures, costs associated with treating COVID-19, and an increased number of uninsured patients, all of which lead to lower profitability. While some may think lower patient volumes are a “new normal” for the hospital industry, this operator is well-positioned to continue growing profits over the long term. Investors who can see past the temporary disruption to Universal Health Services, Inc. (UHS: $100/share) operations can find great value in this Long Idea.
Universal Health Service’s History of Profit Growth
Universal Health Services has a strong history of profit growth. Over the past decade, Universal Health Services has grown revenue by 8% compounded annually and core earnings[1] by 12% compounded annually, per Figure 1. Longer term, Universal Health Services has grown core earnings by 13% compounded annually over the past two decades. The firm increased its core earnings margin from 4% in 1999 to 7% in the trailing-twelve-month period (TTM).
Figure 1: Core Earnings & Revenue Growth Over the Past Decade
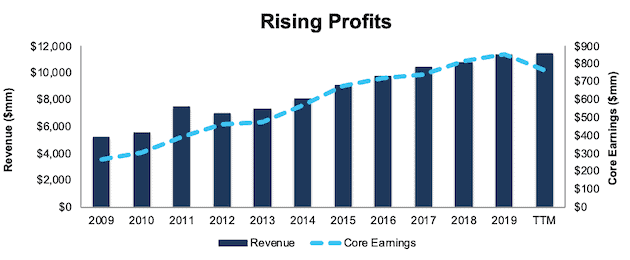
Sources: New Constructs, LLC and company filings.
Universal Health Services’ rising profitability helps the business generate significant free cash flow (FCF). The company generated positive FCF in nine of the past 10 years and a cumulative $2.3 billion (28% of market cap) in FCF over the past five years. Universal Health Services’ $968 million in FCF over the TTM period equates to an 8% FCF yield, which is significantly higher than the Healthcare sector average of -1%.
Ample Liquidity to Survive the Downturn
While COVID-19 has disrupted Universal Health Services’ patient volume in the short term, the firm’s available liquidity positions it to survive the current economic downturn. At the end of 1Q20, the firm had ~$1.2 billion available under its current credit facilities. Additionally, the firm received nearly $239 million in CARES Act and other state and local government grants. Medicare provided the firm with $376 million in accelerated payments.
In addition to having a strong cash balance, the firm has implemented cost reduction initiatives, suspended its share repurchase and dividend programs, and reduced planned capital expenditures for 2020 from ~$800 million (midpoint) to ~$600 million. The firm spent $184 million on capex in 1Q20.
In a worst-case scenario, where Universal Health Services generates no revenue, the firm could operate for over three months with its available liquidity before needing additional capital. This scenario assumes Universal Health Services maintains spending at current levels, including salaries, wages and benefits, lease and rental expense, revolving facility repayments, and interest expenses ($1.5 billion in 1Q20) and an expected monthly capex of $222 million.
However, it’s highly unlikely that Universal Health Services’ revenue would go to zero given its diverse geographical presence and the essential nature of its operations in the current environment. The firm generated $2.8 billion in revenue in 1Q20, which included the first few weeks of the healthcare industry’s response to the COVID-19 pandemic. The firm noted that in April 1 to April 30, 2020, acute care patient admissions were down 31% and behavioral health admissions were down 28% from the prior year – numbers much lower than 100%.
A more likely worst-case scenario is the extended duration of the 31% and 28% declines in the business. In this case, other operating expenses and supplies expenses would equal $219 million (31% 1Q19 levels) per month and revenue would be closer to $644 million per month (31% below 1Q19 levels). The firm could survive for 16 months at this level of depressed revenue before needing additional capital.
Superior Profitability Helps Maintain Patient Care During the Crisis and Grow in the Recovery
At least 29 hospitals have already filed for bankruptcy this year, and COVID-driven disruptions to the hospital industry may drive even more operators out of business. Universal Health Services, with its cash flow and profitability, is positioned to weather the downturn and take share during a recovery.
Universal Health Services’ invested capital turns, a measure of balance sheet efficiency, was superior to all but one of its peers – HCA Healthcare Inc (HCA), which we was a Long Idea in June. Other peers include Tenet Healthcare Corp (THC), Community Health Systems, Inc. (CYH), Select Medical Holdings Corp (SEM), and Encompass Health Corp (EHC).
While Universal Health Services NOPAT margin ranks third, it still achieves a high return on invested capital (ROIC) relative to peers.
Figure 2: NOPAT Margin, Invested Capital Turns, and ROIC vs. Peers
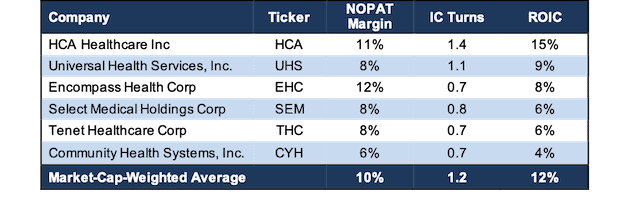
Sources: New Constructs, LLC and company filings.
Unless you believe that there will be no demand for acute and behavioral care in a post-COVID-19 world, it’s hard to argue against Universal Health Services’ ability to survive. And, if it survives, it’s hard to argue that the firm’s superior profitability before the crisis will not translate into growth opportunities and profit growth after the crisis.
Business Lines Provide Diversified Revenue Streams in Growing Markets
Universal Health Services’ business is divided into two segments: acute care with 47 facilities (including 26 hospitals) and behavioral care with 349 facilities. Per Figure 3, 54% of the firm’s consolidated revenue comes from acute care while behavioral care accounts for the remaining amount.
Figure 3: Universal Health Services’ 1Q20 Revenue Mix
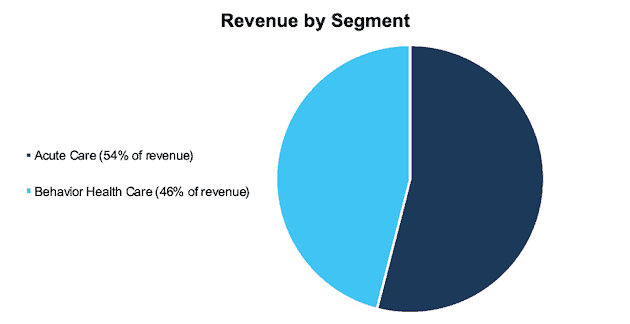
Sources: New Constructs, LLC, company filings
Demand for Universal Health Services’ Acute Care is Rising
Universal Health Services’ acute care operations are more geographically focused than its behavioral health services, which operate across the United States and United Kingdom.
Texas, California, and Nevada are the three largest revenue-generating regions for Universal Health Services and are home to 20 of the firm’s 26 acute care hospitals. Each of these states are expected to grow faster than the U.S. population as a whole over the next decade. The University of Virginia Weldon Cooper Center, Demographics Research Group expects the aggregated populations of these three states to grow by 12.2% from 2020 to 2030 compared to just 7.7% for the total U.S. population. Increased population drives organic growth in demand for hospital services.
Growth in these states have helped the firm improve its occupancy rate of available beds from 59% in 2015 to 64% in 2019.
In addition to addressing the needs of a growing market, the U.S. population is aging. The population of those aged 65 and older is expected to increase from ~56 million today to ~73 million in 2030. 2030 marks the first year where all baby boomers will be 65 or older. While this group represented 16% of the U.S. population in 2016, they represented 36% of the total U.S. health spending in that year. In 2017, per capita spending for those 65 and older was nearly double that of the average population. We expect an increase in the age of the population will translate into increased demand and spending for acute care.
Behavioral Care Demand is Also Rising
Some may think that advancements in medical treatments will permanently rid the world of mental disorders. Elon Musk recently discussed one of his latest projects, a brain chip that will cure human depression and addiction. New hallucinogenic and psychedelic therapies are also emerging to treat mental health disorders.
While various treatments may prove useful for certain situations, no single treatment is likely to permanently cure all mental health and substance abuse. Further, even as we have advancements in our treatments in behavioral health, the number of people needing treatment is increasing.
The U.S. has many behavioral health challenges as nearly one in five adults live with a mental illness and suicides have increased by 34% since 2000. These behavioral and mental health challenges led to a 32% increase in U.S. psychiatric services from 2014 to 2018 with a 15% increase in psychiatric spending from 2017 to 2018.
Universal Health Services recognized the opportunity to provide better behavioral health care and has been focused on expanding this important business segment. In 2009, behavioral health revenue comprised just 25% of the firm’s total revenue. By the end of 2019, the firm’s behavioral health revenue accounted for 46% of total revenue. Over this period total behavioral health revenue grew from $1.3 billion to $5.2 billion or 15% compounded annually.
Demand for Universal Health Services’ behavioral health services has declined in the short term, as patients have avoided treatment facilities during the COVID-19 pandemic. However, the firm is optimistic that it will recapture its pre-COVID behavioral health volume once business resumes more normal levels of operation.
The added stress brought on by the pandemic make this scenario even more likely, as 39% of American’s said in May that stress related to coronavirus has had a negative impact on their mental health. With its facilities spread across the country, Universal Health Services is ready to provide behavioral healthcare, assist in improving the mental health across the country, and grow its business at the same time.
Two Competitive Segments Lead to More Total Market Share
The firm’s behavioral care operations enjoy lower capital requirements, minimal exposure to uncompensated care, stable pricing, and higher occupancy levels. For example, in 2019, the firm’s occupancy rate for available beds in its behavioral health centers was 75% compared to 64% for its acute care operations. These advantages help the firm improve its margins and profitability.
Universal Health Services also provides quality healthcare. All of the firm’s acute care facilities are fully accredited by the independent organizations The Joint Commission (TJC) and/or Commission on Accreditation of Rehabilitation Facilities (CARF). In 40 years of operations, neither TJC nor any other Centers for Medicare and Medicaid Services-deemed organization have failed to accredit or reaccredit any of the firm’s facilities. Nine of the organization’s 26 (35%) acute care hospitals received ‘A’ scores from Leapfrog Group’s Spring 2020 Hospital Safety Grade. For comparison, in the firm’s three largest markets of Texas, California, and Nevada, only 24% of all acute care hospitals received an ‘A’ from the Leapfrog Group in Spring 2020.
In its behavioral care centers, patient responses to aftercare surveys revealed that in 2019:
- 91% of patients felt better at discharge than when they were admitted
- 90% of patients were satisfied with their treatment
- 86% would recommend the facility to someone needing treatment
Demographic tailwinds and high-quality care have driven steadily improving same facility revenue. The firm grew same facility revenue from $4.1 billion in 2012 to $6.1 billion in 2019 or 6% compounded annually, per Figure 4.
Figure 4: Universal Health Services’ Same Facility Growth
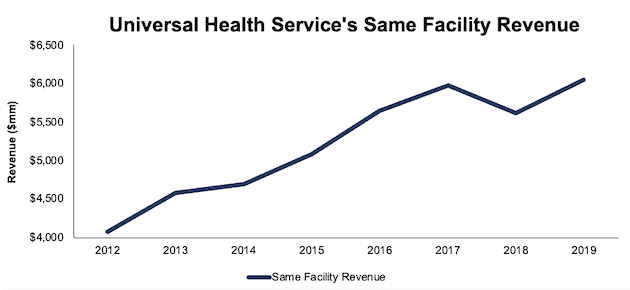
Sources: New Constructs, LLC, company filings
Universal Health Services’ same facility revenue growth has helped the firm expand its share of total national hospital care expenditures. Per Figure 5, Universal Healthcare Services’ share of national hospital care expenditures has increased from 0.68% in 2010 to 0.86% in 2019.
Figure 5: Universal Health Service’s Share of National Hospital Care Expenditures
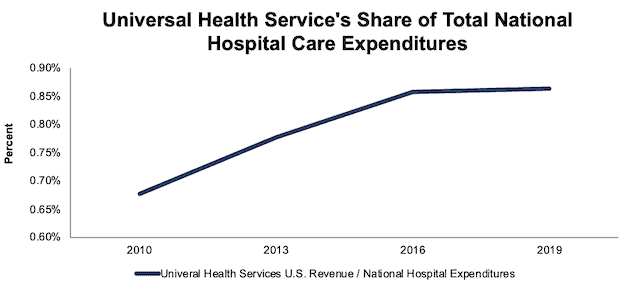
Sources: New Constructs, LLC and CMS.gov
*2019 value based on CMS projections
In our Long Idea on HCA Healthcare, we noted how the firm is positioned to increase its market share during and after the pandemic. Currently, HCA Healthcare and Universal Health Services’ combined share of national hospital expenditures is just 5%, which leaves 95% of the market available for these two firms to increase their share of this highly fragmented market.
The COVID-19 pandemic is having an adverse impact on Universal Health Services’ operations in the short term, as patients delay treatments when possible. However, we believe Universal Health Services is well-positioned, as a leading healthcare provider, to continue to provide for patients, address medical and behavioral needs, and even increase its share of healthcare spending once the pandemic is behind us.
UHS Is Undervalued
After falling 30% year-to-date (YTD) to $100/share, UHS now trades significantly below its economic book value (EBV), or no-growth value. Its current price-to-economic book value (PEBV) ratio of 0.7 is the cheapest in the history of our model, which goes back to 1998. This ratio means the market expects Universal Health Service’s NOPAT to permanently decline by 30%. This expectation seems overly pessimistic over the long term. For reference, Universal Health Service has grown NOPAT by 11% compounded annually over the past decade.
Universal Healthcare Services’ current economic book value[2] is $152/share – a 52% upside.
Figure 6: Stock Price vs. Economic Book Value (EBV) Calculated with 10-Year Average WACC
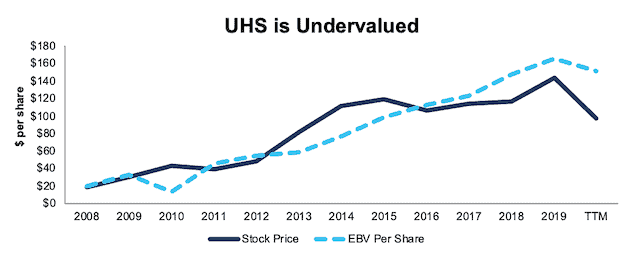
Sources: New Constructs, LLC and company filings.
UHS’s Current Price Implies No Economic Recovery
Despite consensus estimates for year-over-year (YoY) revenue growth in 2021 and 2022, UHS is priced as if the COVID-driven economic decline will permanently depress profits. Below, we use our reverse DCF model to quantify the cash flow expectations baked into Universal Health Services’ current stock price. Then, we analyze the implied value of the stock based on different assumptions about COVID-19’s impact on the economy and Universal Health Service’s future growth in cash flows.
Scenario 1: Using historical revenue declines, historical margins, and average historical GDP growth rates, we can model the worst-case scenario already implied by Universal Health Services’ current stock price. In this scenario, we assume:
- NOPAT margin falls to 5% (company low in 1999, compared to 9% 2019) in 2020 and stays at that level until 2025. Margins increase to 8.5% (10-year average) in 2025 and each year thereafter
- Revenue falls 31% (equal to the firm’s YoY acute care admission decline in April) in 2020 and does not grow until 2025 (vs. 2021 consensus estimates +10.5%)
- Sales grow from 2025 onward at 3.5% a year, which is the average global GDP growth rate since 1961
In this scenario, where Universal Health Services’ NOPAT declines by 2% compounded annually over the next decade (including a 60% YoY drop in 2020), the stock is worth $102/share today – nearly equal to the current stock price. See the math behind this reverse DCF scenario.
For reference, Universal Health Services saw its largest YoY NOPAT decline in 2004 when the firm sold several hospitals as part of a restructuring plan. NOPAT declined 12% in 2004 before growing 10% compounded annually over the next five years.
Figure 7 compares the firm’s implied future NOPAT to its historical NOPAT in this scenario. This worst-case scenario implies Universal Health Services’ NOPAT 10 years from now will be 21% below its 2019 NOPAT. In other words, this scenario implies that 10 years after the COVID-19 pandemic, Universal Health Services’ profits will have only recovered to 4% below 2015 levels. In any scenario better than this one, UHS holds significant upside potential, as we’ll show below.
Figure 7: Current Valuation Implies Severe, Long-Term Decline in Profits: Scenario 1

Sources: New Constructs, LLC and company filings.
Scenario 2: Long-term View Could Be Very Profitable
If we assume, as does the International Monetary Fund (IMF) and nearly every economist in the world, that the global economy rebounds and returns to growth starting in 2021, UHS is undervalued.
In this scenario, we assume:
- NOPAT margin falls to 5% (company low in 1999, compared to 9% 2019) in 2020 and increases to 8.5% (10-year average) in 2021 and each year thereafter
- Revenue falls 31% (equal to the firm’s YoY acute care admission decline in April) in 2020
- Sales begin growing again in 2021, but only at 3.5% a year, which is the average global GDP growth rate since 1961
In this scenario, Universal Health Services’ NOPAT falls by less than 1% compounded annually over the next decade (including a 60% YoY drop in 2020) and the stock is worth $139/share today – a 39% upside to the current price. See the math behind this reverse DCF scenario.
For comparison, Universal Health Services has grown NOPAT by 7% compounded annually over the past five years and 11% compounded annually over the past decade. It’s not often investors get the opportunity to buy an industry leader at such a discounted price.
Figure 8 compares the firm’s implied future NOPAT to its historical NOPAT in scenario 2. This moderate scenario implies that a decade from now, Universal Health Services’ NOPAT will only be 2% above 2018 levels and 3% below 2019 levels. If profits return to these levels in less than 10 years, UHS has even more upside potential.
Figure 8: Implied Profits Assuming Moderate Recovery: Scenario 2
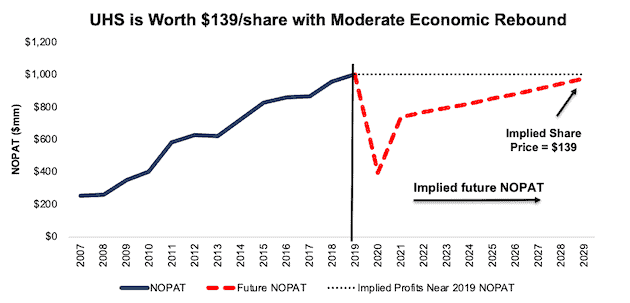
Sources: New Constructs, LLC and company filings.
Sustainable Competitive Advantages Will Drive Shareholder Value Creation
Here’s a summary of why we think the moat around Universal Health Services’ business will enable it to continue to generate higher NOPAT than the current market valuation implies. The following competitive advantages help Universal Health Services’ survive the downturn and return to growth as the economy grows again:
- Strong balance sheet to survive the economic dip
- Large presence in growing regions of the U.S.
- Superior profitability to its peer group
What Noise Traders Miss with Universal Health Services
These days, fewer investors focus on finding quality capital allocators with shareholder-friendly corporate governance. Instead, due to the proliferation of noise traders, the focus is on short-term technical trading trends while high-quality fundamental research is overlooked. Here’s a quick summary of what noise traders are missing:
- Strong history of core earnings growth
- Demographic tailwinds
- The firm’s growing market share
- Valuation implies non-urgent hospital care never recovers
The Yield Is on Hold but Should Return
Universal Health Services has taken many measures to preserve capital during the current environment, including suspending its dividend and share buyback programs.
Before the suspension, the firm increased its declared dividend from $0.40/share in 2018 to $0.60/share in 2019. Over the past five years, the firm generated far more in in free cash flow ($2.3 billion) than it paid out in dividends ($207 million), or an average $561 million surplus each year. Its last quarterly dividend, when annualized, equaled $0.80/share and provided a 0.8% yield.
Firms with cash flows greater than dividend payments have a higher likelihood to maintain and grow dividends. While Universal Health Services suspended its dividend in the short term, investors buying at current prices should get a nice yield with upside potential as the firm reinstates the dividend over the long term.
Historically, Universal Health Services has also returned capital to its shareholders through share repurchases. Universal Health Services has repurchased $2.1 billion (31% of current market cap) since 2015.
Prior to suspending its repurchase program, the firm had $560 million (7% of current market cap) remaining for future repurchases under its current authorization. Should the firm start repurchasing shares once the economy stabilizes, or even returns to growth, it would provide additional yield for investors.
A Consensus Beat or Signs of Recovery Could Send Shares Higher
According to Zacks, consensus estimates at the end of March pegged Universal Health Services’ 2020 EPS at $10.59/share. Jump forward to July 20, and consensus estimates for Universal Health Services’ 2020 EPS have fallen to $6.29/share. 2021 estimates follow a similar trend. At the end of March 2021 EPS consensus was $11.67/share, which has since fallen to $9.95/share.
Though the COVID-19 pandemic has reduced healthcare demand, these lowered expectations provide a great opportunity for a strong operator, such as Universal Health Services, to beat consensus, if not this quarter, then maybe the next. Though our current Earnings Distortion Score, which is a short-term indicator of the likelihood to beat or miss expectations, for Universal Health Services is “In-Line”, lowered expectations moving forward could make it much easier to beat earnings.
The firm beat EPS estimates in six of the past 10 quarters, and doing so again, in the midst of such market turmoil, could send shares higher.
Furthermore, any signs of demand for elective treatments returning to pre-COVID-19 levels or significant progress in a vaccination for COVID-19 would send shares higher. Lastly, if Universal Health Services does recapture its pre-COVID behavioral health volumes as it expects, the firm could beat earnings expectations and provide another boost to the stock price.
Executive Compensation Tied to Return on Capital
No matter the macro environment, investors should look for companies with executive compensation plans that directly align executives’ interests with shareholders’ interests. Quality corporate governance holds executives accountable to shareholders by incentivizing them to allocate capital prudently.
Universal Health Services’ executive compensation includes annual base salary, annual cash incentive, long-term incentive awards, and deferred compensation.
The firm’s long-term incentives are awarded through stock options tied to individual performance, responsibilities, and contribution to the firm’s financial performance.
Universal Health Services’ annual cash incentive is tied to the firm’s achievement of target adjusted net income per diluted share and return on capital. Return on capital is defined as adjusted net income attributable to Universal Health Services divided by quarterly average net capital.
While return on capital is similar to ROIC, we would prefer the firm use ROIC improvement when determining executive compensation, as there is a strong correlation between improving ROIC and increasing shareholder value. Using and having accurate values for NOPAT and invested capital (instead of using adjusted net income and average net capital) ensures investors have an apples-to-apples metric for measuring corporate performance and holds management accountable for every dollar invested into the company.
Despite not using a precise measure ROIC when measuring performance, Universal Health Services’ compensation plan has not compensated executives while destroying shareholder value. Universal Health Services has grown economic earnings by 12% compounded annually over the past decade and 13% compounded annually over the past two decades.
Insider Trading and Short Interest Trends
Over the past twelve months, insiders have bought a total of 515 thousand shares and sold one million shares for a net effect of 543 thousand shares sold. These sales represent less than 1% of shares outstanding.
There are currently 1.1 million shares sold short, which equates to 1% of shares outstanding and just over one day to cover. Short interest is down 35% from the prior month. The low and declining short interest indicates few investors have an appetite to bet against this best-in-class performer.
Critical Details Found in Financial Filings by Our Robo-Analyst Technology
As investors focus more on fundamental research, research automation technology is needed to analyze all the critical financial details in financial filings as shown in the Harvard Business School and MIT Sloan paper, "Core Earnings: New Data and Evidence”.
Below are specifics on the adjustments we make based on Robo-Analyst findings in Universal Health Services’ 2019 10-K:
Income Statement: we made $416 million of adjustments, with a net effect of removing $190 million in non-operating expenses (2% of revenue). You can see all the adjustments made to Universal Health Services’ income statement here.
Balance Sheet: we made $546 million of adjustments to calculate invested capital with a net increase of $280 million. One of the largest adjustments was $168 million in asset write-downs. This adjustment represented 2% of reported net assets. You can see all the adjustments made to Universal Health Services’ balance sheet here.
Valuation: we made $4.3 billion of adjustments with a net effect of decreasing shareholder value by $4.3 billion. There was one adjustment that increased shareholder value by $3 million. Apart from $4.2 billion in total debt, the most notable adjustment to shareholder value was $76 million in minority interests. This adjustment represents 1% of Universal Health Services’ market cap. See all adjustments to Universal Health Services’ valuation here.
Attractive Funds That Hold UHS
The following funds receive our Attractive rating and allocate significantly to UHS:
- Reinhart Mid Cap PMV Fund (RPMVX) – 3.0% allocation
- FormulaFolios U.S. Equity Fund (FFILX) – 3.0% allocation
[1] Our core earnings are a superior measure of profits, as demonstrated in Core Earnings: New Data & Evidence a paper by professors at Harvard Business School (HBS) & MIT Sloan. The paper empirically shows that our data is superior to “Operating Income After Depreciation” and “Income Before Special Items” from Compustat, owned by S&P Global (SPGI).
[2]We utilized the override capability in our Company Valuation Model to calculate UHS’ TTM EBV using the firm’s 10-year average weighted average cost of capital (WACC) to derive an EBV that is less sensitive to any changes in WACC. This approach is especially useful in the current low interest rate environment. While we do not know where interest rates will go in the future, calculating EBV with the 10-year average WACC gives a more conservative EBV in the event interest rates increase in the future.
Disclosure: David Trainer, Kyle Guske II, and Matt Shuler receive no compensation to write about any specific stock, style, or theme.


