
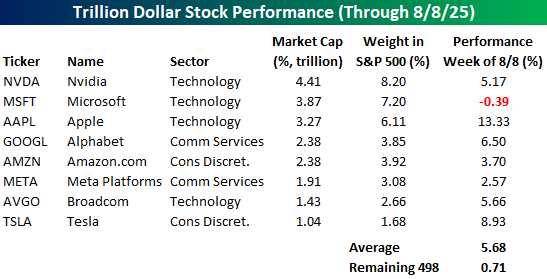
The mega-cap stocks took the baton last week and drove the market higher. While the S&P 500 was up about 2.4%, the 492 stocks in the index with market caps of less than a trillion dollars were up an average of just 0.71%. Meanwhile, the eight $1+ trillion dollar stocks were up an average of 5.7%, led higher by stocks like Apple (AAPL) and Alphabet (GOOGL) with gains of more than 5%. Weren’t these two stocks that the street had written off for dead just a couple of weeks ago?
Collectively, the eight $1+ trillion stocks account for over 35% of the S&P 500. These are, and will continue to be, the main drivers of the market.
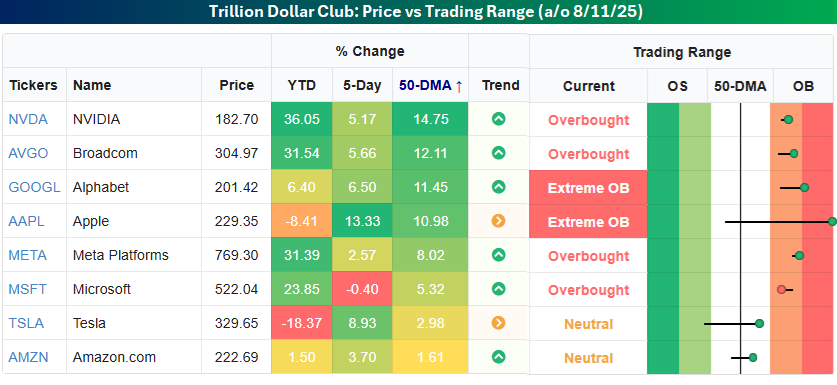
Some of the trillion dollar stocks have gotten quite extended, with Nvidia (NVDA), Broadcom (AVGO), Alphabet (GOOGL), and Apple (AAPL) now trading more than 10% above their 50-day moving averages.
In Thursday’s Morning Lineup, we noted the dispersion in YTD performance using the Dow Jones Industrial Average as an example. Within the trillion-dollar stocks, we’ve seen the same degree of divergence with more than 50 percentage points separating the group's biggest YTD winner and loser.
(Click on image to enlarge)
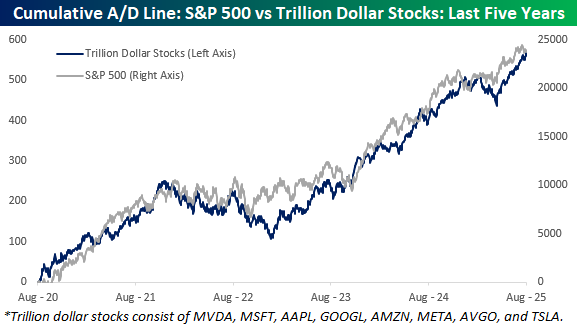
Since the trillion-dollar stocks will have such a large say in how the market moves from here, we wanted to check up on the group’s breadth compared to the S&P 500. The chart below compares the S&P 500’s cumulative A/D line to the cumulative A/D line of the trillion-dollar stocks over the last five years. For the most part, they have tracked each other very closely, and both remain near record highs, so there’s been no major divergence between the mega-caps compared to the rest of the market.
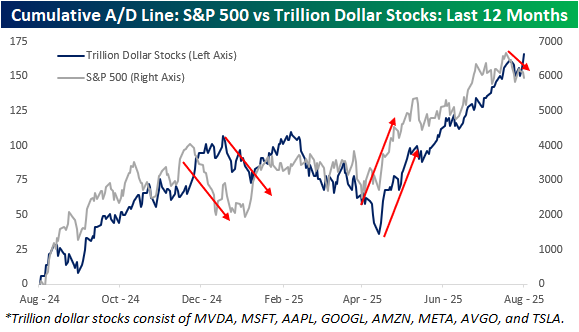
Zooming in on the last year shows similar patterns in both cumulative A/D lines, but with more granularity, you can also see some zigs in the S&P 500’s cumulative A/D line when the cumulative A/D line of the trillion-dollar stocks zags. Late last year, the S&P 500’s cumulative A/D line started to roll over about a month before the trillion-dollar stocks, and then in the Spring, the S&P 500’s A/D line bottomed a couple of weeks before the trillion-dollar stocks. That brings us to last week. As mentioned above, while the S&P 500 was up sharply last week, the majority of the gains were the result of the big moves higher in the trillion-dollar stocks. That divergence was also evident in the cumulative A/D lines as the S&P 500 finished the week well off its 7/25 high, while the one for the trillion-dollar stocks hit a new high. At this point, it’s just a modest divergence, but the last two divergences began modestly as well before turning into more extended moves.
More By This Author:
The World's 3,028 BillionairesIncreasing Earnings Vol
Quitters Never Win


Comments
Log in or sign up to join the conversation.