
The Reflation Narrative Stumbles Out Of The Gate
With a 4.4% increase in economic growth in the third quarter and expectations that it could be higher in the fourth quarter, the so-called reflation narrative appears primed to dash out of the gates in 2026 at its current strong pace. The problem with assuming the reflation narrative will hold in 2026 is that it ignores important real-time inflation data. Before explaining a potential flaw in the reflation narrative lets define what it is. Per ChatGPT:
The reflation narrative is the belief that aggressive fiscal spending, easy monetary policy, and rising liquidity will sustainably accelerate economic growth, lift inflation, steepen yield curves, and favor cyclical and inflation-sensitive assets.
Economic activity is a function of demand. Thus, when economic growth is accelerating, as it has been, we must assume demand is increasing. However, the GDP data, portending strong demand, lags months behind real-time economic indicators. Thus, more real-time demand gauges allow us to assign a confidence level to the reflation forecast.
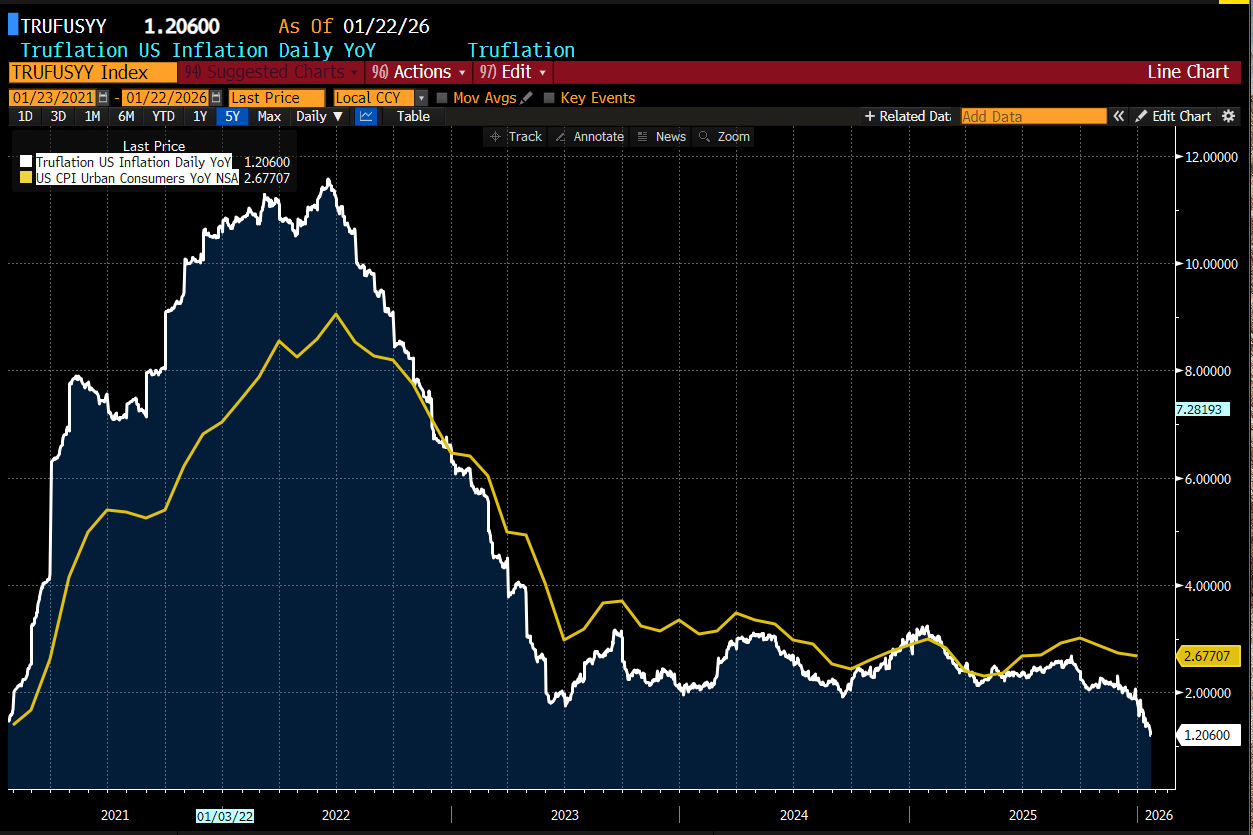
Truflation is a real-time private sector inflation gauge. It uses millions of online prices, transaction data, and private datasets to reflect actual consumer behavior and price changes. As we share below, courtesy of Bloomberg, the daily Truflation estimate of CPI has fallen sharply to 1.20%, well below the 2.00% level it began the year at. Further, the graph shows the strong leading correlation between Truflation and CPI. Presuming Truflation is an accurate measure of demand and prices, CPI should start declining rapidly, implying that the economic growth rate is likely to gravitate to lower levels, leading us to question the reflation narrative.
What To Watch Today
Earnings
(Click on image to enlarge)

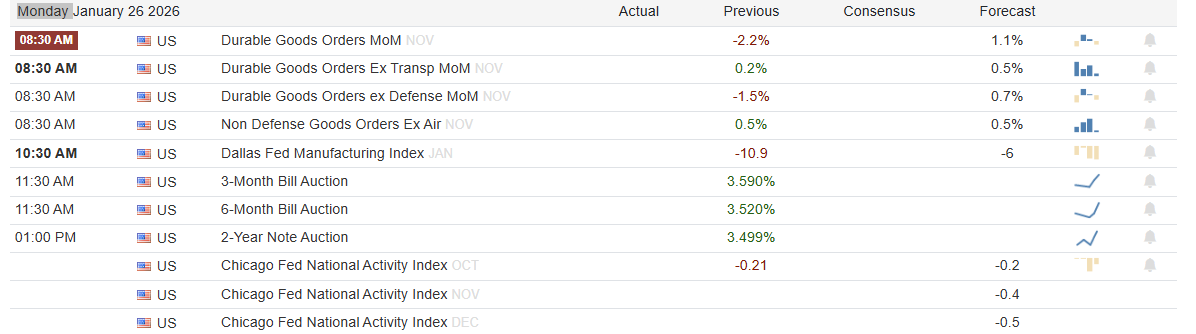
Economy
(Click on image to enlarge)
Market Trading Update
This week’s price action reflected growing short‑term volatility and technical signals that traders use to gauge potential risk and reward. After a politically driven selloff early in the week, market internals weakened before recovering mid‑week. The CBOE Volatility Index (VIX) surged above 20.0 on Tuesday, then quickly retraced back toward 17.0 by Friday, highlighting swings in fear and complacency among traders. A high, then rapid drop in VIX suggests short‑term traders may be reducing hedges after the headline shock passed, but volatility could remain elevated in the weeks ahead. As MarketWatch observed, “a recent spike in the fear gauge was swiftly erased after tariff threats were softened,” yet analysts warn that sustained volatility remains likely.
(Click on image to enlarge)

Breadth measures are also telling a mixed story. Major indexes like the S&P 500 and Nasdaq closed the week with only modest net movement, but many breadth indicators remain tepid. Recent market breadth data showed that a smaller proportion of S&P 500 stocks are making new highs even as the index approaches record levels, signaling a more narrow leadership. This pattern often precedes a larger corrective phase if broader participation does not improve, and recent analysis pointed to ongoing breadth weakness despite headline strength.
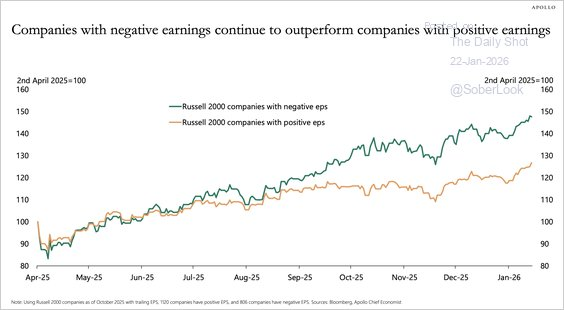
Rotation is evident beneath the surface. Small‑cap stocks and cyclical sectors have outperformed as of late, pushing the Russell 2000 to a series of record highs and outperforming megacaps year‑to‑date. However, small-caps are now very overbought and extended, suggesting a near-term rotational risk is becoming more likely. Furthermore, this shift away from the largest, momentum tech names, which generate a significant share of earnings growth, to more economically and non-profitable companies is a risk if economic “reflation” fails to mature. Such a rotation into small capitalization companies can be constructive, but only if it broadens rather than temporarily lifts market averages.
With the market closing at 6,915,on Friday, here are key technical support and resistance levels to watch going into next week:
Resistance Levels
• Primary resistance: 7,000 — First initial resistance following any attempt to break out to new all-time highs.
• Secondary resistance: 7,100 — First initial Fibnocci extension level.
• Extended resistance: 7,200 — Third Fibonacci extension level
Support Levels
• Primary support: 6,913 — 20-day moving average.
• Secondary support: 6,836 — 50‑day moving average and recent lows.
• Key support: 6,378 — 100-day moving average
These levels are critical guides. A breakout to new all-time highs on strong volume could signal continuation of the broader uptrend, whereas a break below 6,836 would shift short‑term momentum toward deeper correction risk. Traders should continue to monitor portfolio risk and rebalance as needed until the market provides better direction with a trend in one direction or the other.
The Week Ahead
Earnings from the largest companies alongside the FOMC meeting should make for an interesting week.
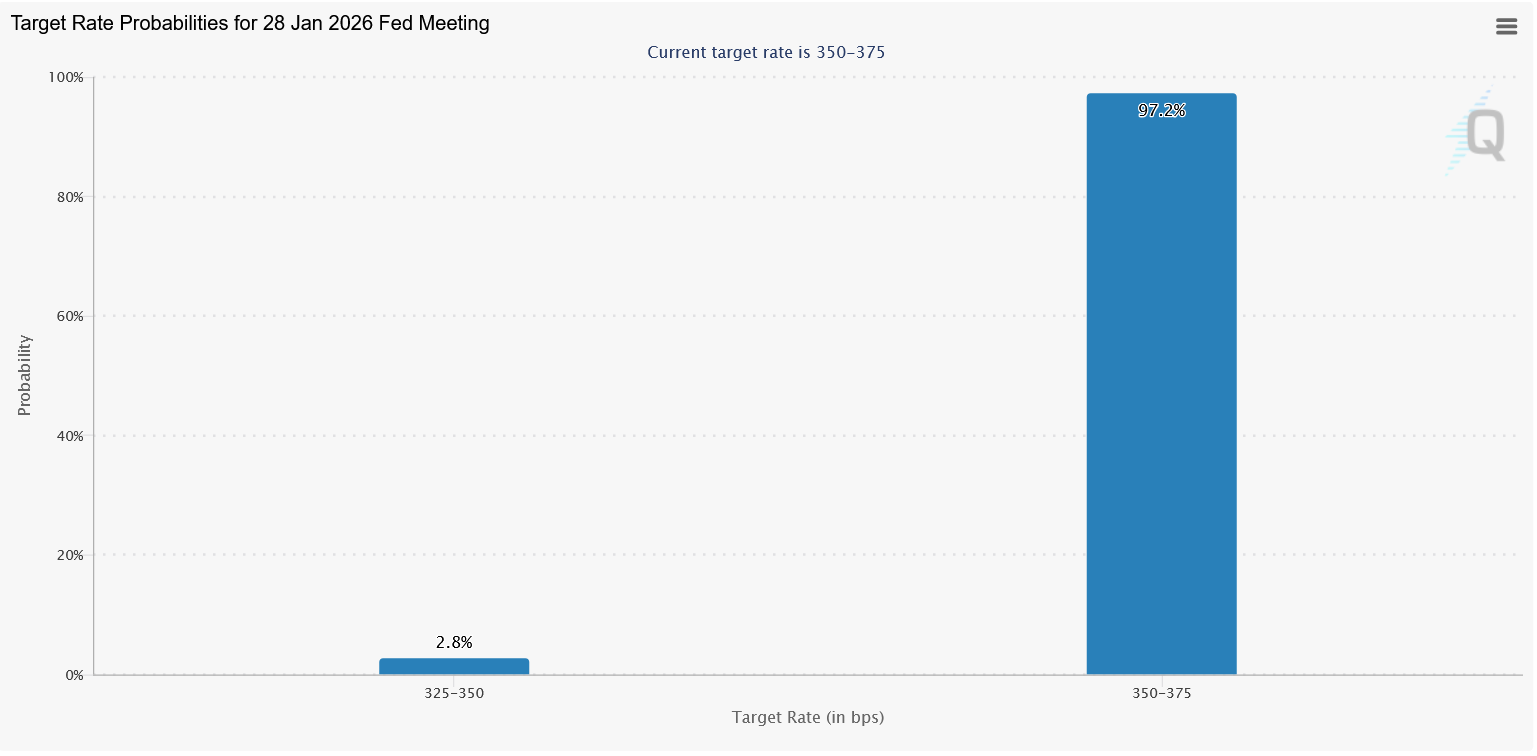
The Fed meets on Wednesday to update its monetary policy. There are slim odds of a rate cut, as shown below, nor does Wall Street expect Powell to change the Fed’s outlook. Given the recent bump in GDP and stubborn inflation, Powell is likely to take a more hawkish stance and push back on potential rate cuts.
Five of the Magnificent Seven stocks report earnings this week. Microsoft, Meta, and Tesla announce their fourth quarter results on Wednesday, followed by Apple and Amazon on Thursday. Unlike in prior quarters, these stocks have been underperforming the market. Therefore, there is more upside potential if earnings are strong. Conversely, poor earnings could feed some of the negative narratives surrounding the “AI Bubble” and keep these stocks relatively weak.
The South Park Market Of 2026
Notably, in South Park, Eric Cartman once declared, “Screw you guys, I’m going home.” That line has become shorthand for frustration and fatigue when chaos overwhelms you during market volatility. For example, during the “Liberation Day” market decline, many investors sold out just as the market reached its bottom. The increase in market volatility was something we wrote about this time last year in “Curb Your Enthusiasm.” Notably, the same market dynamics that existed then persist today. Such suggests that investing in 2026 may also experience similar increases in volatility. That means anyone looking for a simple road map will end up feeling like Cartman walking out on his friends.
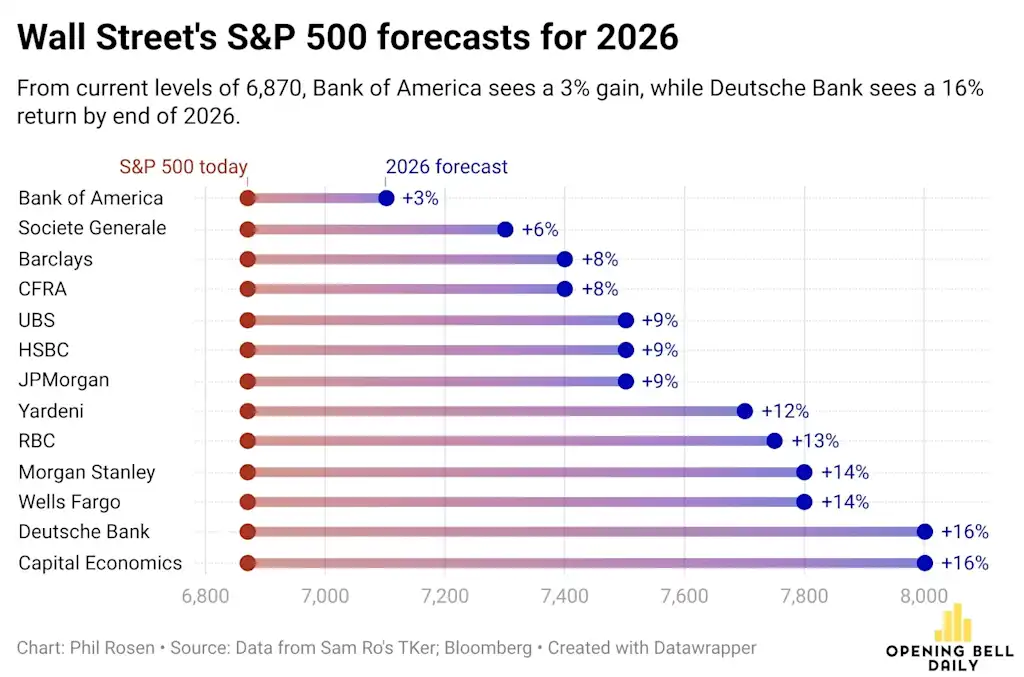
To avoid being Cartman, it is critical to understand that 2026 will not deliver certainty. Instead, investors should focus and make decisions based on probabilities backed by data, earnings trends, policy shifts, and macro signals. Wall Street analysts have already begun issuing universally bullish forecasts, some more cautious than others. However, while there are no guarantees of outcomes, a shifting environment of volatility and complexity is expected.
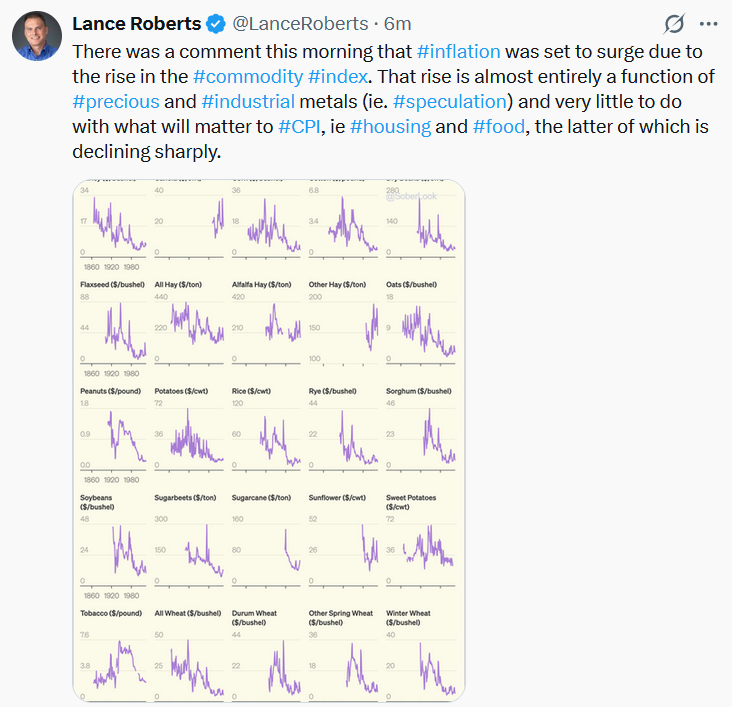
Tweet of the Day
More By This Author:
Investment Risk Is UnderappreciatedThe South Park Market Of 2026
Silver Math: Gold Warns Of Silver Correction
Disclaimer: Click here to read the full disclaimer.


