
The Nasdaq's Troubles May Be Early Days

How do you quantify how speculative the market became before this winter’s decline?
As stocks marched inexorably higher through 2020 and 2021—after, ahem, running for 11 years prior to that—I think many people retired as soon as their IRA hit their “number”.
But how many people are we talking about? Your guess is as good as mine. Whatever the figure, we can add to them some other groups: people who made fortunes in crypto, or 10 times their money in Tesla. No doubt about it, many dropped out of the labor force.
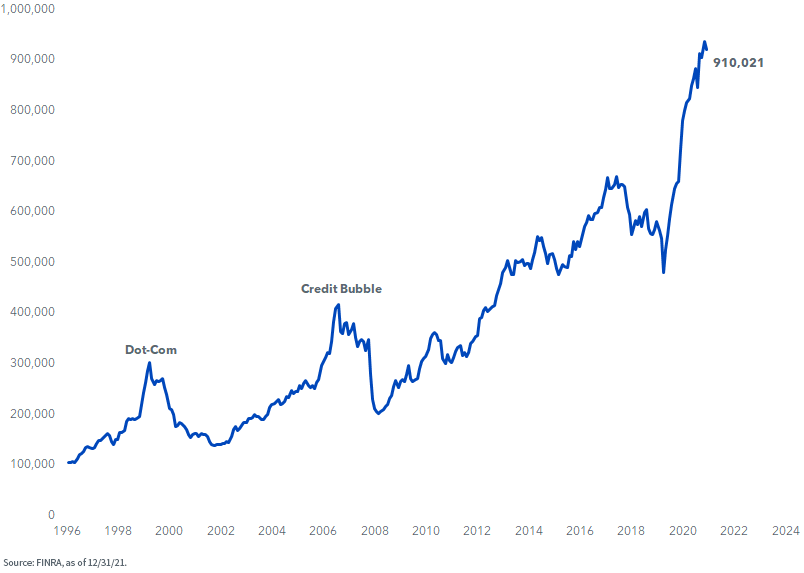
What we do know, if we are looking to put a number on these things, is that brokerage account margin debt melted up to $910 billion in December (figure 1). My concern is that a lot of this money is in securities like AMC and GameStop, in growth funds…or Nasdaq trackers.
If you squint at the final tick in figure 1, the peak was in November. The January data isn’t in yet, but rest assured, people are getting margin calls.
Figure 1: Debit Balances in Customers’ Securities Margin Accounts ($ mil.)
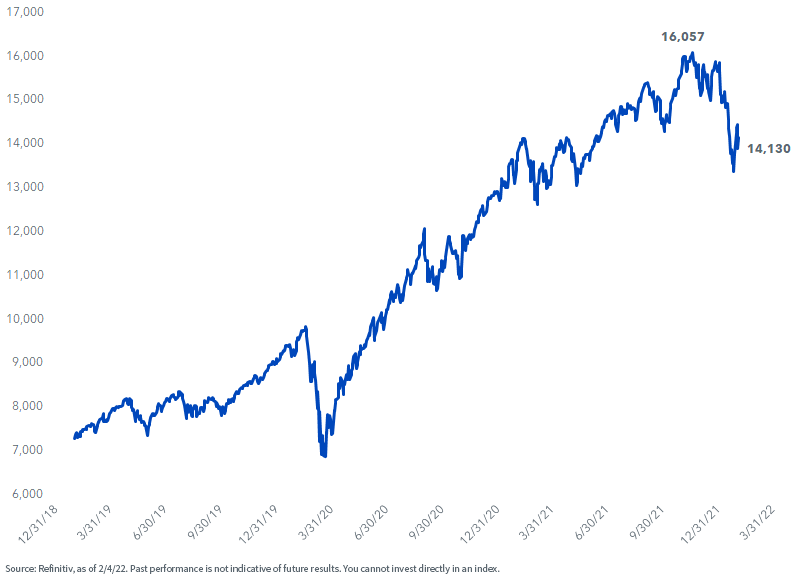
The situation in the Nasdaq Composite is not pretty, with a decline from 16,057 on November 19, 2021, to current levels around 14,000 (figure 2).
Figure 2: Nasdaq Composite
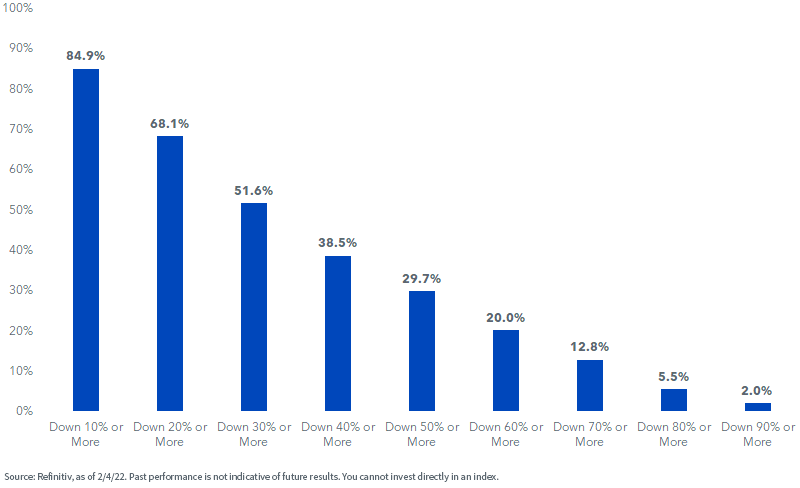
As bad as that looks, many companies have been hit harder. More than 29% of Nasdaq’s components have halved from their 52-week highs (figure 3).
Figure 3: Nasdaq Composite % Constituents Showing Declines from 52-Week Highs
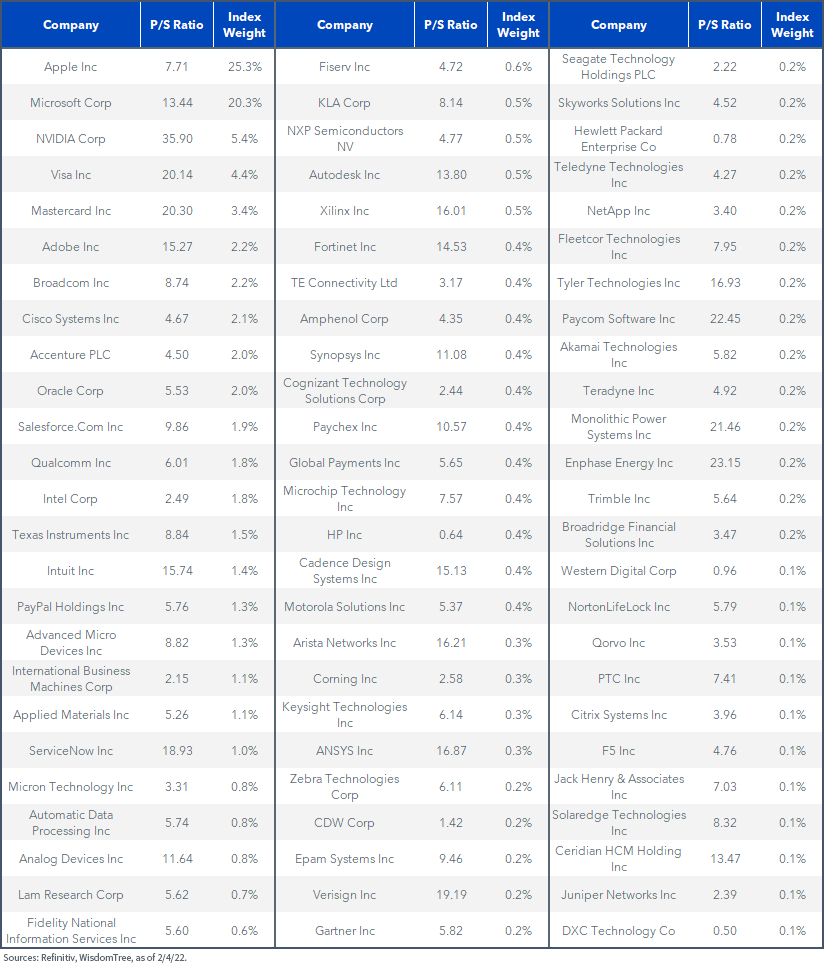
At the peak of the 1990s bubble, the S&P 500 Information Technology sector traded for 6.8 times sales. Look at how many stocks are trading above that level, even after recent declines (figure 4).
Figure 4: S&P 500 Information Technology Constituents’ Price-to-Sales (P/S) Ratio
(Click on image to enlarge)
An argument I often hear to defend today’s large-cap growth stocks is that few companies in the “Class of 1999” had viable business models or profits for that matter.
Not true.
Okay, there were tons of silly dot-coms in that market, but they were sideshows. The Nasdaq’s top 10 by market cap back then were (from smallest to largest): JDS Uniphase, Applied Materials, Yahoo, Qualcomm, Dell, Sun Microsystems, Oracle, Intel, Cisco, and Microsoft.
Consider the biggest one, Microsoft. Like today, Microsoft was a great company in 1999. A great company at a horrible price. In the fiscal years from 1996 to 2000, Microsoft posted annual earnings of $0.43, $0.66, $0.84, $1.42, and finally, $1.70.
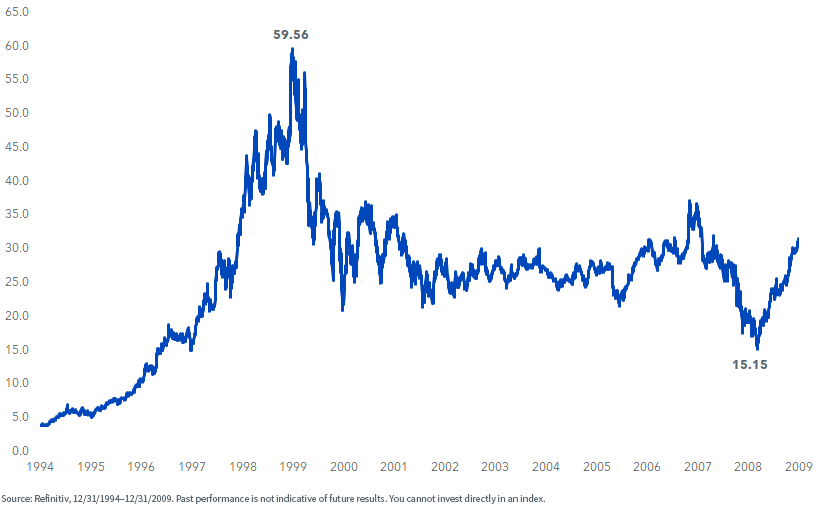
Somebody paid $59 for that stock in 1999, or 35 times forward earnings. You can buy great companies all you wish, but if you pay too much, you get a rotten egg (figure 5).
Figure 5: Microsoft Stock Price, Tech Bubble through Global Financial Crisis
Disclaimer: Investors should carefully consider the investment objectives, risks, charges and expenses of the Funds before investing. U.S. investors only: To obtain a prospectus containing this ...
more

