
While it feels like it has been a year of persistent Murphy’s Law for the Stock Market, sometimes it makes sense to just take a step back and look at the facts. What could go wrong, did go wrong (War, Geopolitics, Hurricanes, Supply Chains, Government/Policy actions, regional pandemic persistence, Fed Policy errors) but we may be coming to the tail end of that narrative:

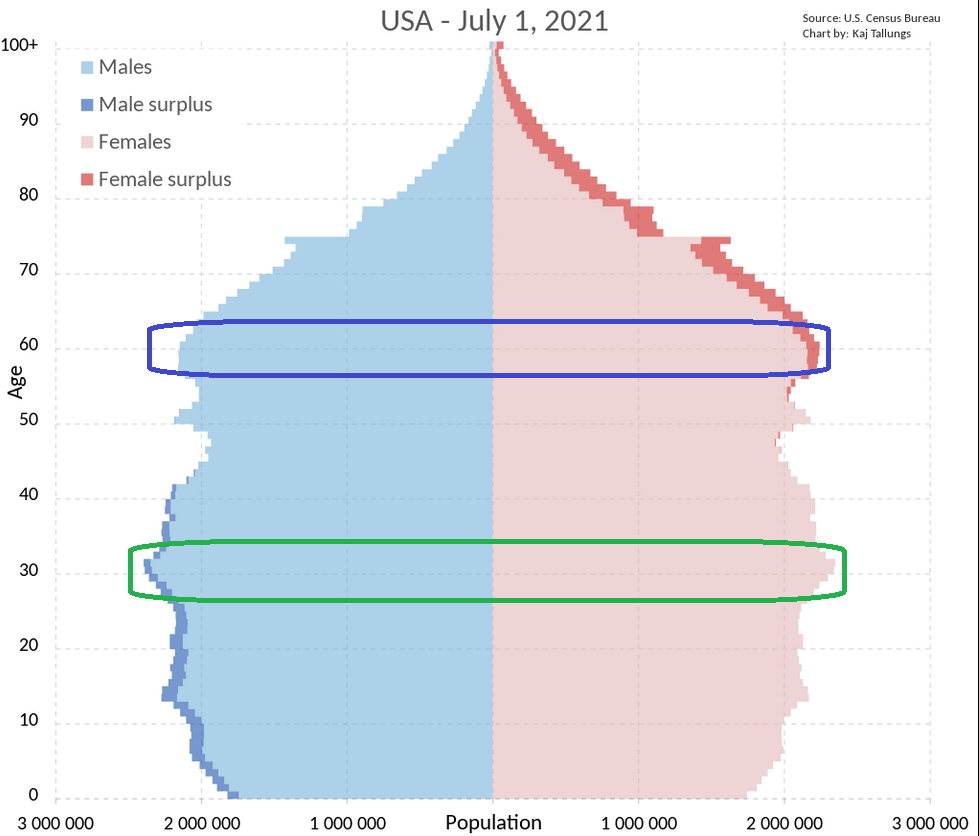
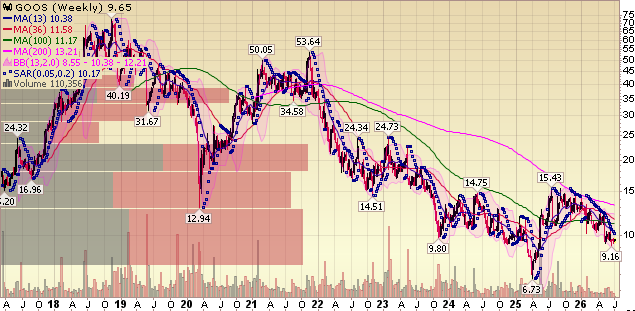
When you look at the featured chart above, the words that come to mind are “The Long Run.”
As I’ve stated since the Pandemic lows, we are only mid-way through a secular bull market driven by Millenials’ housing and family formation. The same demographic conditions existed in 1982-2000 and well as 1953-1968. We are having some short-term growing pains, but will power through for many more years until this largest portion of out productive population ages to ~40 years old and slows their spending.
The average age of the ~72M Millennials is ~31 right now (Green Circle below). You can see the last time we had a ~31yr old population segment this large was also mid-way into secular bull 30 years ago ~1992 (Blue Circle Below). Spending drives outcomes in an economy that is 70% consumption based:
(Click on image to enlarge)
Other Factors
I can’t tell you whether the CPI print will be hot or cold today and where the markets will be by 4pm, but we can start to look at what could bode well as we move into year-end and beyond:
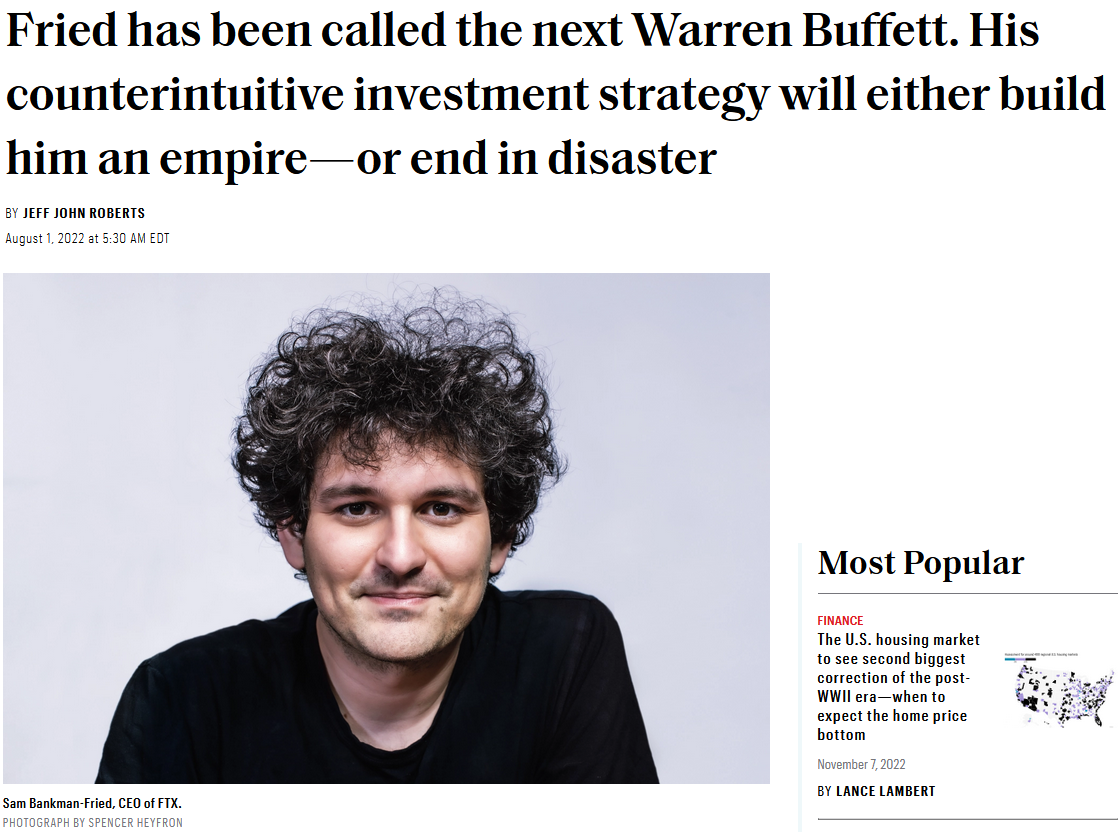
- The “Next Warren Buffett” (a perennial curse bestowed on multiple high-fliers over the years before they crashed and burned) has now been deflated. We’ve spent the past few days absorbing the aftershocks of crypto margin calls and knock-on liquidations in the equity markets. Maybe more to come, but our understanding is the magnitude of the cash loss (contributed capital) if the company (FTX) goes to zero is ~$2B (despite a ~$32B valuation). Customer losses could potentially be up to $10-$20B. The key will be the magnitude of losses in crypto if confidence is lost in the “asset” class, and whether it can be contained. The scale of FTX and even all of the crypto industry in its totality pales in comparison to the trillions of dollars that have been injected into the system just over the past couple of years. I guess this journalist’s question (from August) was answered emphatically this week with a bigger loss of capital than even Archegos/Bill Hwang suffered in March 2021:
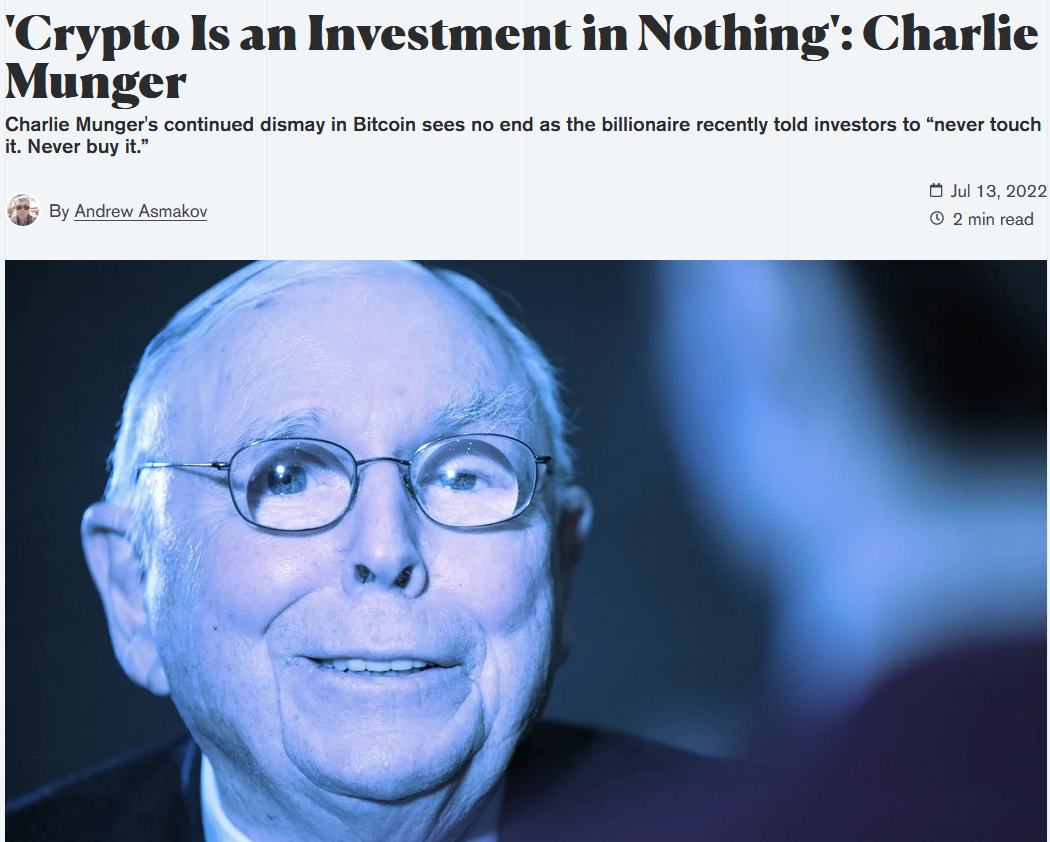
The likely outcome is politicians and policy makers may seize this opportunity to put the genie back in the bottle, crack down on private money and regain their monopoly on money and even digital money with CBDCs.
2. The election, while not resolved – is pointing toward a gridlock outcome – with Repubicans taking control of the House (with ~225 seats) while Democrats could potentially retain the Senate (unknown). It comes down to whether Laxalt can pull off Nevada and whether Walker can pull a rabbit out of the hat in the GA runoff (Republicans currently have 49 and need these two wins to gain control). While the market was positioned for a Red Wave, they got a Red Puddle so far. Puddle or not, it still achieves the same end – any future tax or spending bills will he held up. This means the Fed will no longer be putting our 2 fires (supply driven inflation AND profligate spending) at the same time. The former (supply driven inflation) is aggressively working its way through the system as supply shortages and transport normalizes. The latter (profligate spending) was a Tsunami of fuel on the fire that the Fed had limited ability to overcome ($1.7 TRILLION in the Build Back Better Bill + ~$750 BILLION in the Inflation Reduction Act).
3. The change in the power dynamic in Congress could also lead to greater pressure for Russian and Ukraine to come to the table for a negotiated settlement as aid/weaponry/spending to backstop the Ukraine’s defense is likely to be reduced moving forward. Any resolution would lead to a drop in global energy prices and a tailwind for risk assets. One brick of uncertainty would be removed from the “wall of worry.”
4. Chair Powell is accomplishing what he set out to do with his aggressive tightening. He has wiped out high valuation tech companies (with no earnings), SPACs, cryptocurrencies and even started a slew of mass firings:
META 11,000 (13%). TWITTER 3700 (50%). LYFT 700 (13%). STRIPE 1100 (14%). COINBASE 1100 (18%). SHOPIFY 1000 (10%). SNAP 1000 (20%). ROBINHOOD (31%). TESLA (10%).
Destroy Demand and Increase Unemployment. Expect more to “pain” to come for the economy. The question is how much is already discounted into equity market prices? We will find out in comping weeks.
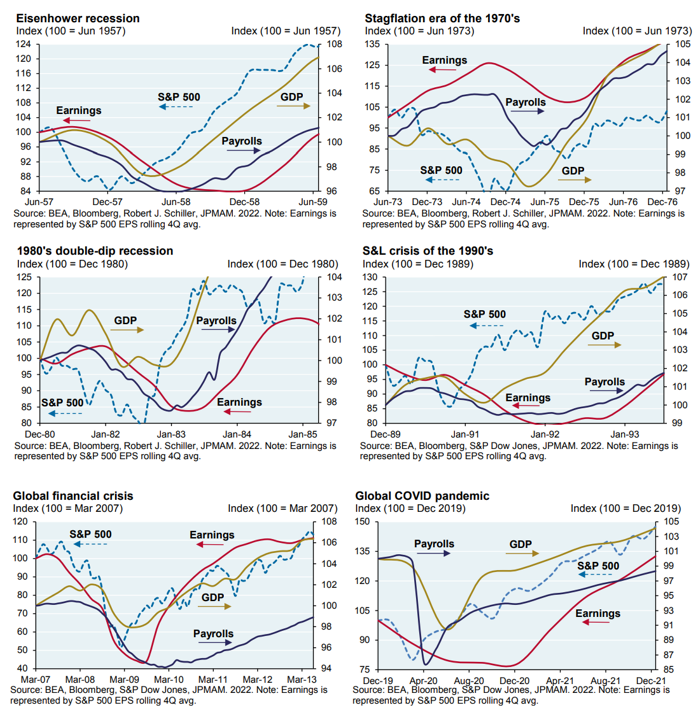
In last week’s podcast|videocast we covered this chart which shows that by the time earnings actually decline to their lowest, the stock market has often ALREADY RECOVERED to NEW HIGHS:
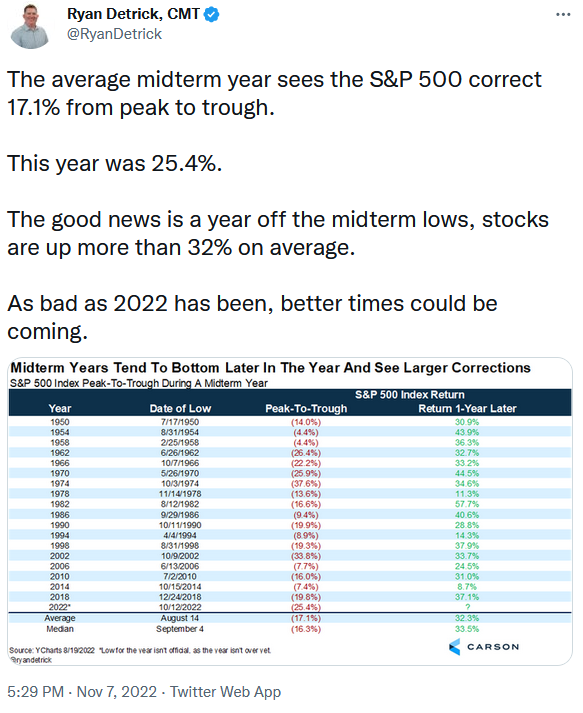
We’ve also discussed the favorable seasonality following a mid-term election year. Hat-tip to Ryan Detrick from Carson Group for all the data:
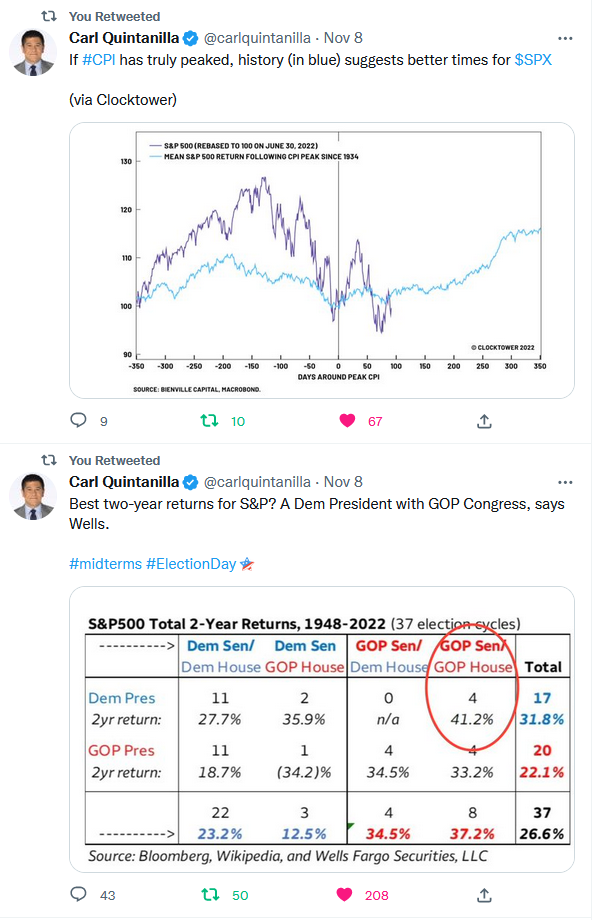
Other inflation/election stats hat-tip Carl Quintanilla:
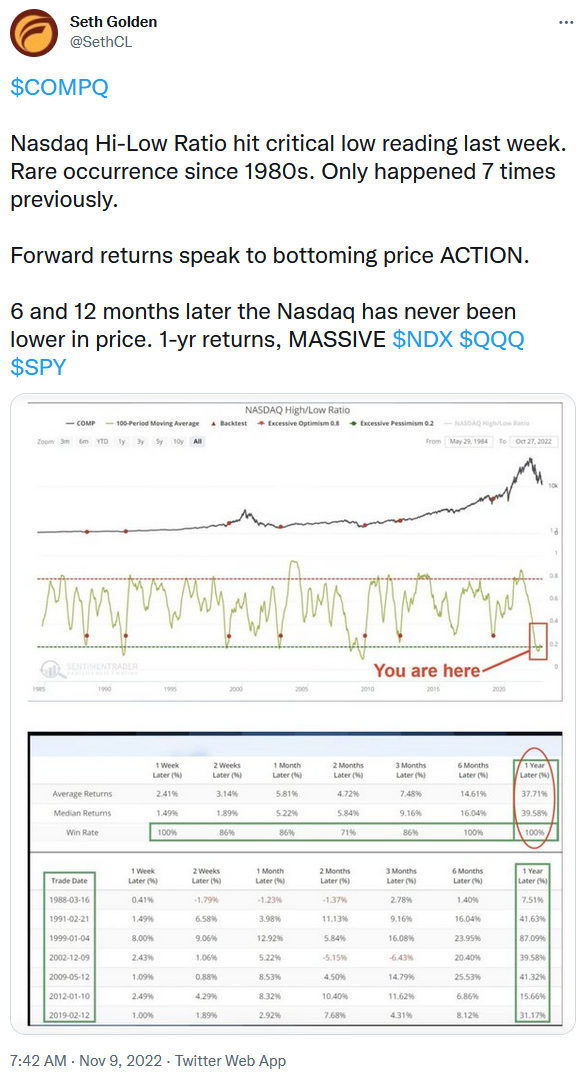
Some Nasdaq positioning data from Jay Kaeppel via Seth Golden:
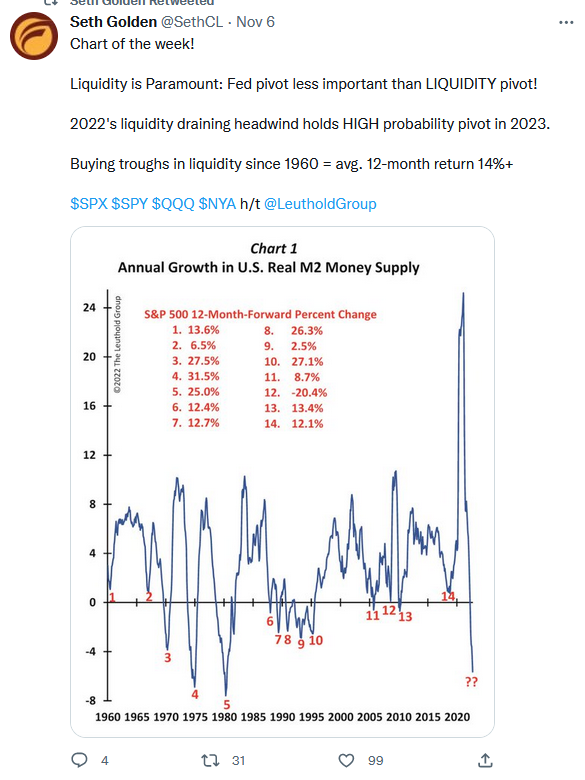
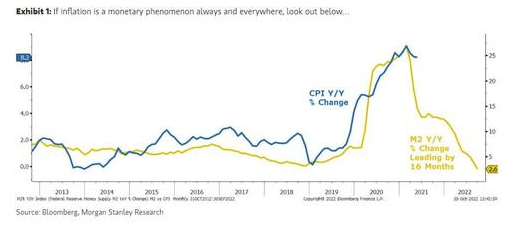
Last week we covered M2 money supply in the context of its correlation to CPI rolling over. This week Leuthold (h/t Seth Golden) discusses the abrupt decline in money supply in the context of forward returns when buying the trough:
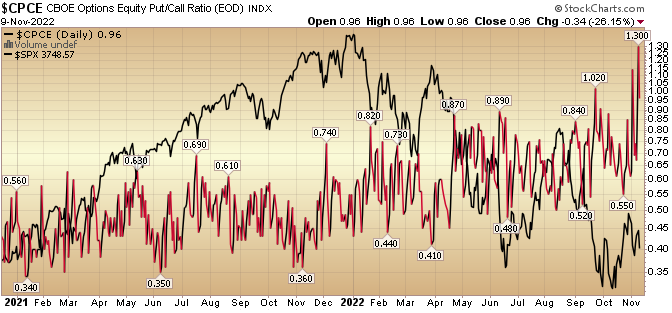
Insurance purchasing of puts peaked again at 1.30 (Put/Call Equity Ratio). Tends to indicate short term bottoms versus tops:
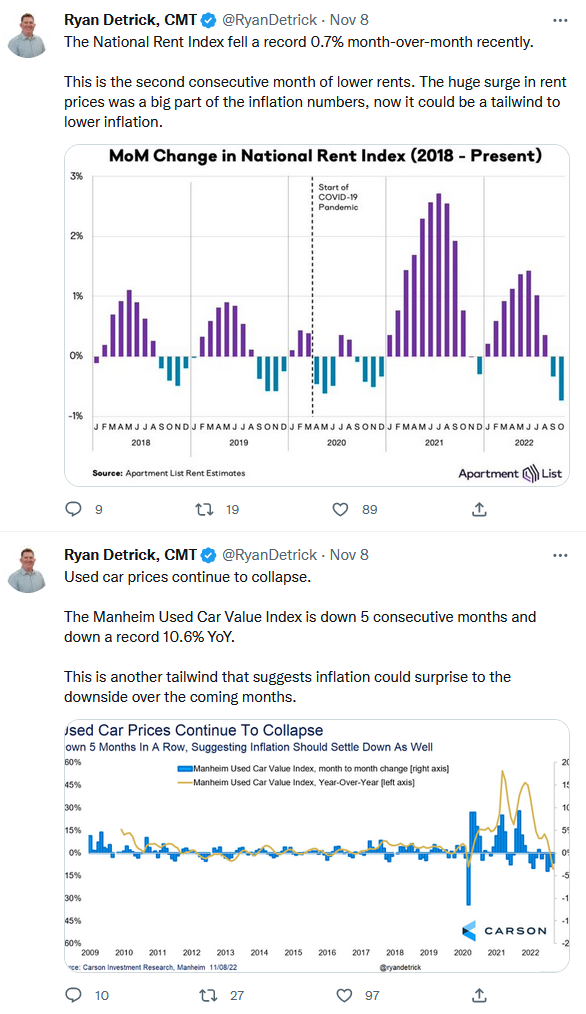
This morning we will find out if declining rents and used car prices will finally be reflected in CPI:
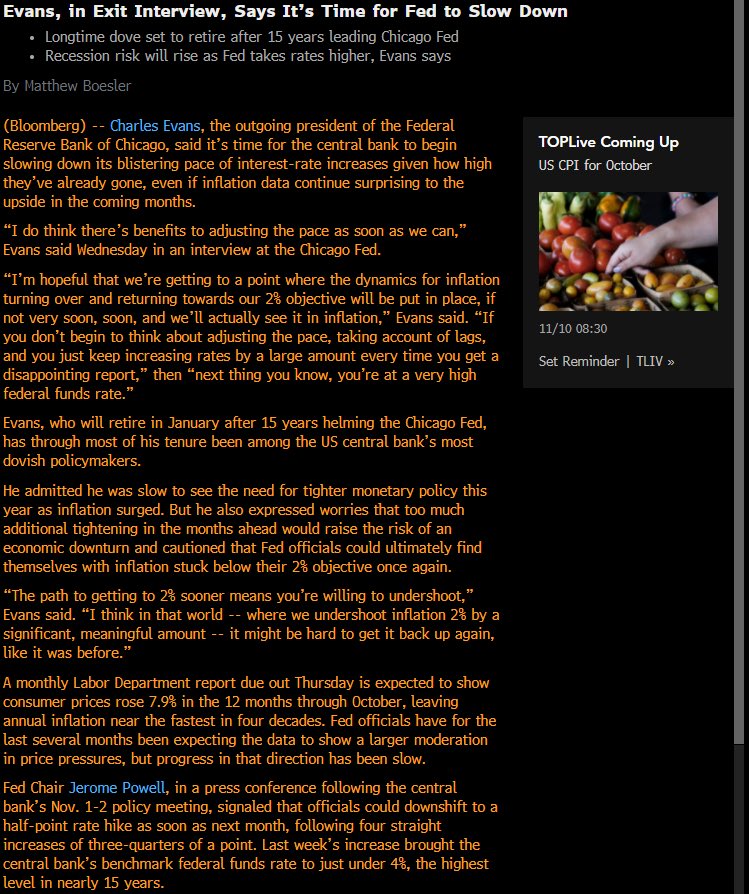
If so, maybe Charles Evans signaled a bit of what’s to come from the Fed:
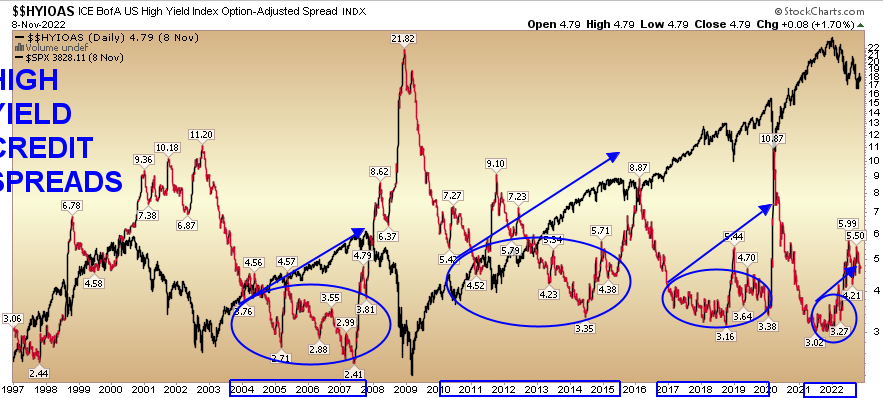
Credit Spreads coming down:
(Click on image to enlarge)
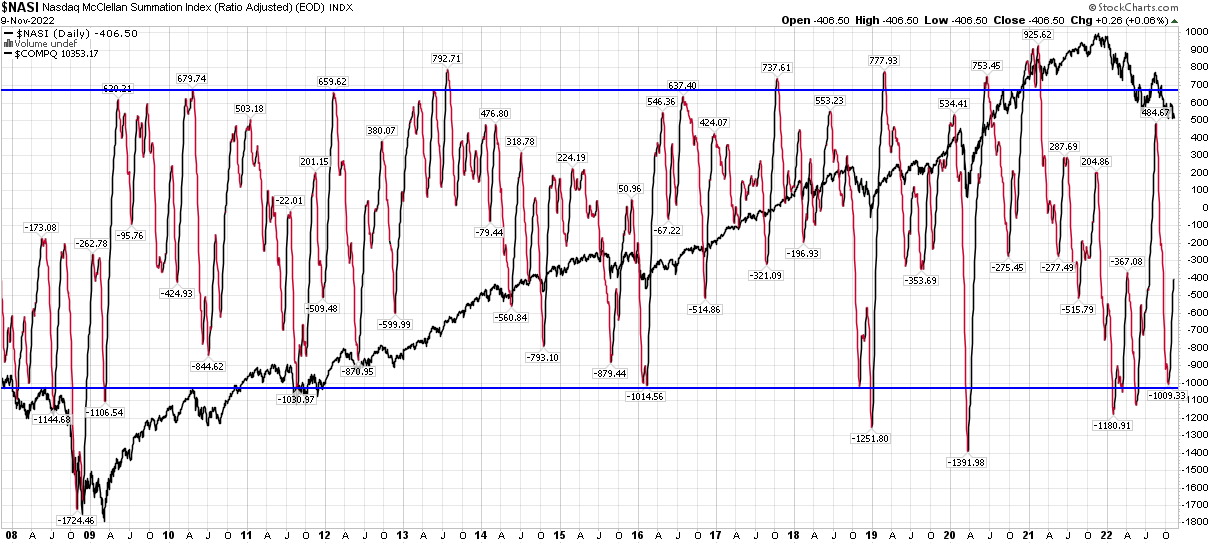
The McClellan Summation Index is a breadth indicator derived from the McClellan Oscillator, which is a breadth indicator based on Net Advances (advancing issues less declining issues). The Summation Index is simply a running total of the McClellan Oscillator values.
(Click on image to enlarge)
Now onto the shorter term view for the General Market:
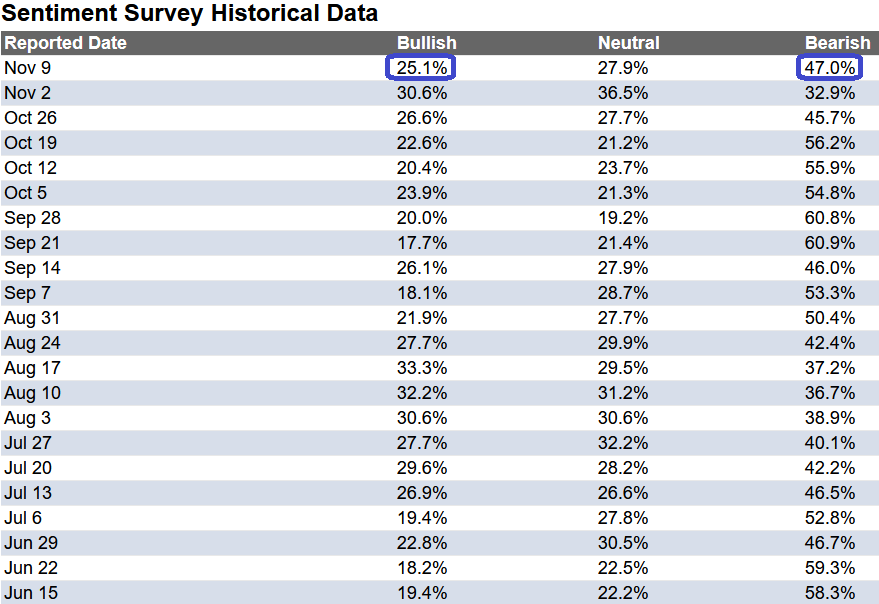
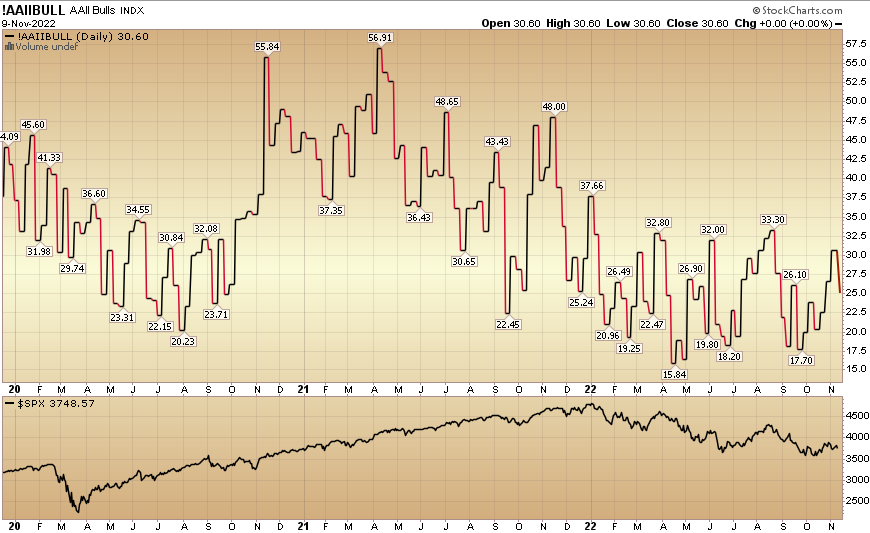
In this last week’s AAII Sentiment Survey result, Bullish Percent (Video Explanation) dropped to 25.1% from 30.6% the previous week. Bearish Percent jumped to 47% from 32.9%. Retail Investors are fearful again.
(Click on image to enlarge)
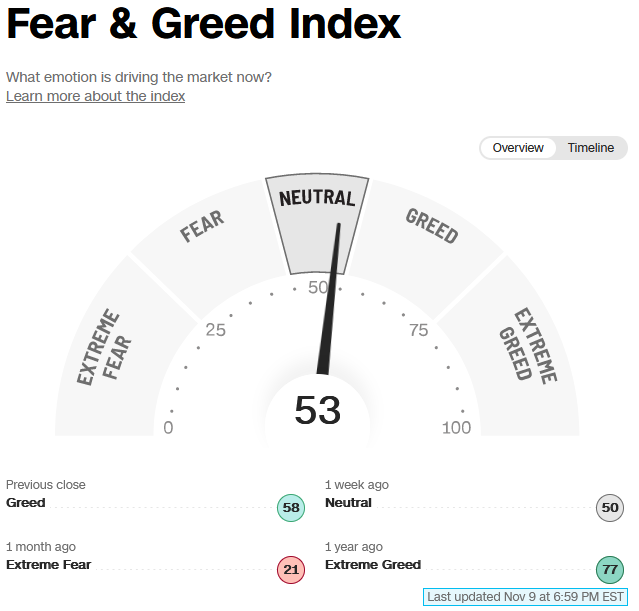
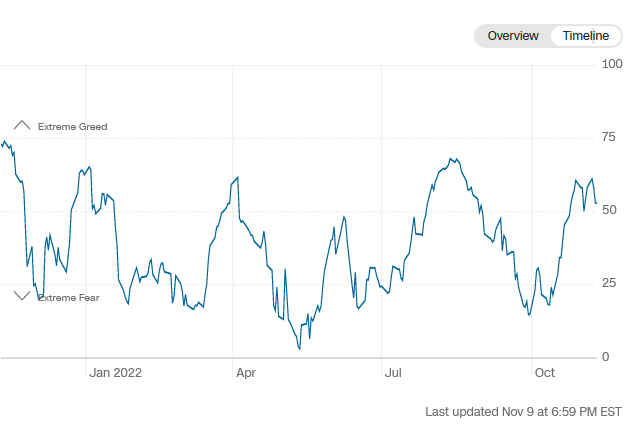
The CNN “Fear and Greed” ticked up from 50 last week to 53 this week. Sentiment is neutral/confused! You can learn how this indicator is calculated and how it works here: (Video Explanation)
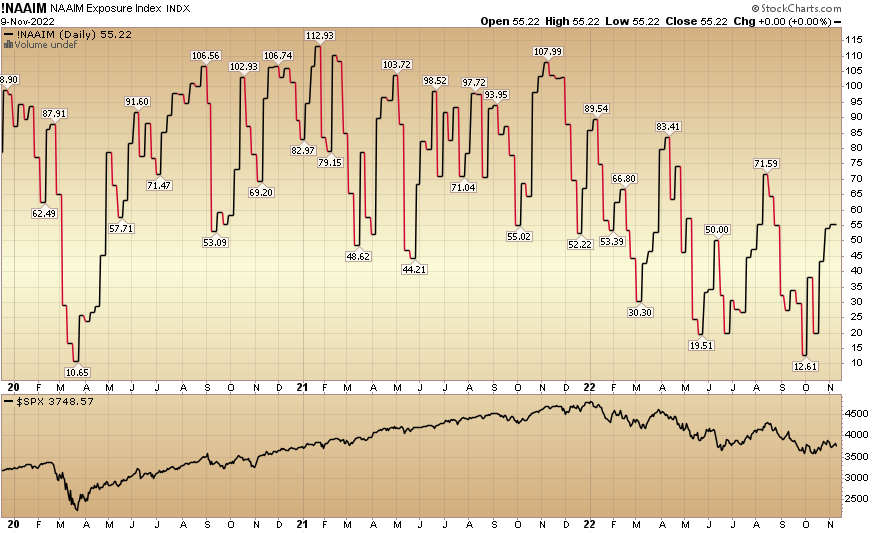
And finally, the NAAIM (National Association of Active Investment Managers Index) (Video Explanation) rose to 55.22% this week from 53.91% equity exposure last week.
(Click on image to enlarge)
More By This Author:
Double-Talk Stock Market (And Sentiment Results)…
“It’s Five O’Clock Somewhere” Stock Market (And Sentiment Results)…
“What To Watch Now” Stock Market (And Sentiment Results)…

Comments
Log in or sign up to join the conversation.