
The Happy Is As "Happy Does” Stock Market - (And Sentiment Results)
This week we chose Kenny Chesney’s 2020 hit, "Happy Does" to embody the current sentiment of the Stock Market:
Laugh and live with a half-full cup
Yeah, happy is as happy does…
The difficulty of predicting a short-term top is particularly harder when everyone is trying to do the same thing. There are no participants left in this market that don’t feel a sense of froth (at least in certain pockets). And while the quantitative indicators support some consolidation, the question is FROM WHERE?
A long-time poker buddy of mine said he was “going to cash” in late September because he thought we would get a 10-15% correction. The problem was – we had just had one in the first three weeks of the month. My response was, “what if you’re right, but it’s from 15% higher than these levels and you’re still out. Do you buy up?”
I had that level of confidence because I understood the amount of liquidity in the system and what the post-election chase would likely look like: The “Back To The Future” Stock Market (And Sentiment Results)
The market never came back down to the levels he sold (after buying up following the March-Sept. rally). Why do I tell this story?
We are at a level where it would be natural to expect some consolidation after a ~70% rally off the March lows. We will probably even get it (just as everyone expects). My sense is it will not be WHEN everyone expects it.
Many people are buying protection on the basis of the Jan 5. Atlanta Senate runoff. Bears say if we have a Democratic win, corporate taxes will go up to 28% and shave $20 off of S&P 500 earnings. Bulls say if we have a Democratic sweep we’ll get a huge multi-trillion dollar spending package which will offset any tax increases.
PredictIt gambling site says it will remain status quo (with the Republicans holding onto the Senate):
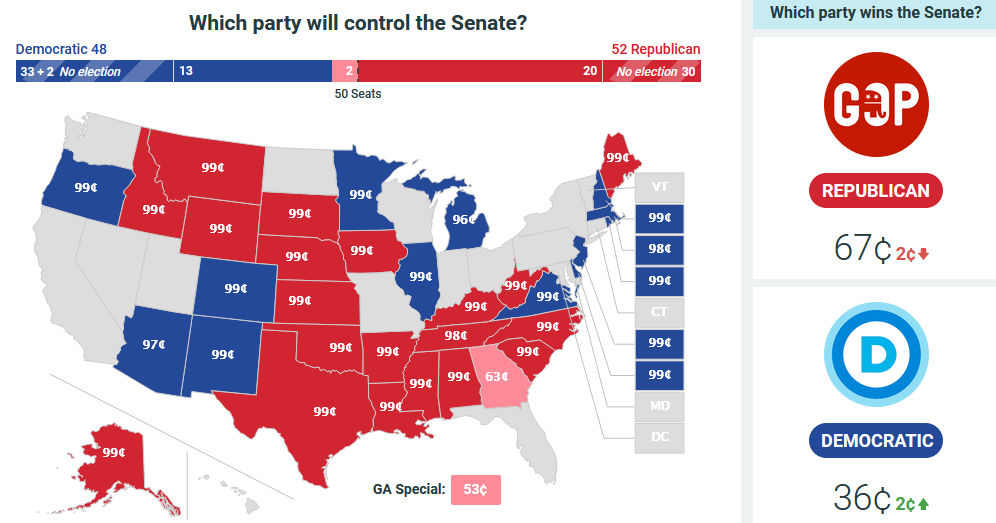
Bears say the January 6th “Certification Vote” could cause volatility. Not sure why as 99.9% chance it goes as planned with a .000001% it doesn’t. With either outcome, you know what you’re getting (as it relates the the Stock Market).
On Christmas Eve I was on Cheddar TV with Kristen Scholer talking about the statistics regarding the Santa Claus rally and what it historically portended – both for the month of January – and for full year 2021. Thanks to Kristen, Ally Thompson and Kara Fellows for having me on.
So now that it appears Santa has come to town, let’s take a look at what the post-election rally of the past two months presages for both January and 2021:
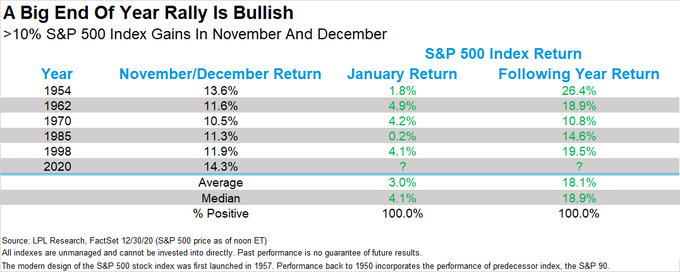
According to Ryan Detrick of LPL, since WWII when you get a double digit rally in Nov-Dec, it tends to carry over not only to January – but double digit gains for the following year.
Keep in mind THIS DOES NOT PRECLUDE an intra-year correction (which average ~14%). So with everyone looking for a knee-capping after the New Year, I think it’s more likely that the market pushes higher and forces a bunch of reluctant money (that sold the March lows and have been waiting for their “big correction” that never came) to get in.
The more likely scenario is a crisis “fake-out” (or delayed result) from the Jan 5-6 “downside catalysts” – in which the put buyers think they have scored – only to find a final push higher forcing the final reluctant longs in before the trap door is finally opened (best guess February time-frame, but who knows).
So that’s all fine, but completely useless information. What? Yes, it’s useless. What’s useful is to understand the new themes for 2021 and beyond so you are positioned to benefit for the full year regardless what corrections, consolidations or volatility fits come our way. If you get the themes right, you won’t get knocked out when the wind blows.
On Monday I had a full 30 minute segment on CNBC Indonesia "Closing Bell" Thanks to Maria Katarina and Yoliawan Hariana for having me on.
In this full segment I cover the key themes we are focused on for 2021 regarding Emerging Markets, Sector Rotation, Gold, US Dollar, Interest Rates, Banks, Defense & Aerospace, Energy, Commodities, etc. The section on the “commitments of traders” report may be especially helpful.
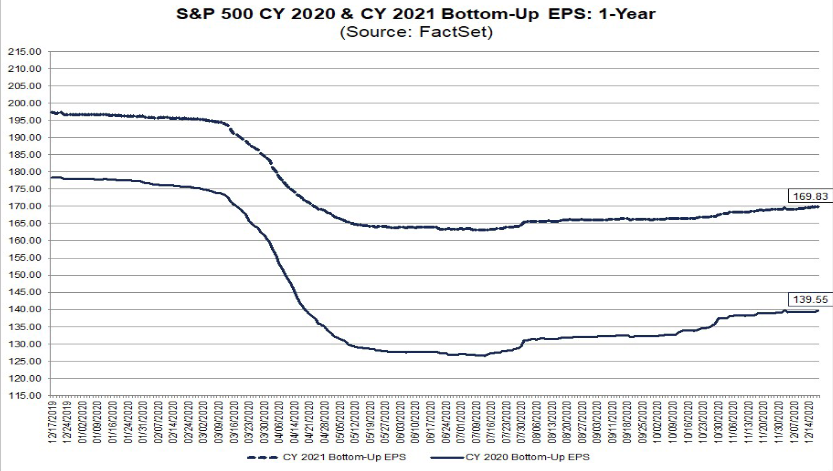
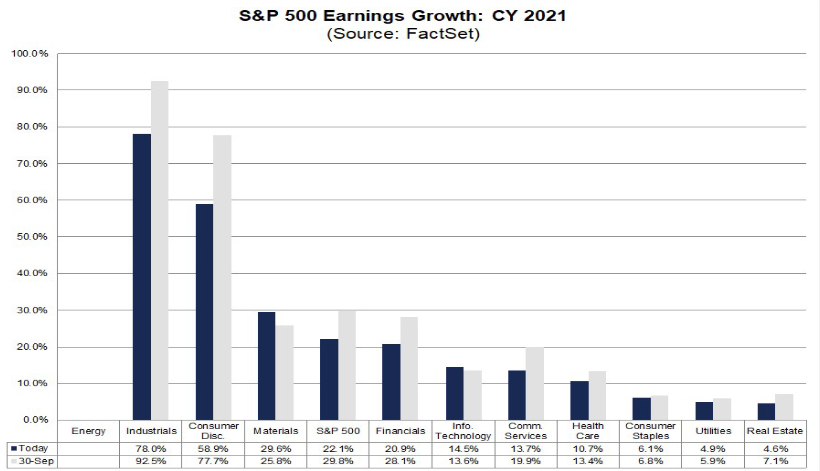
Earnings Revisions
We’ve spent a decent amount of time on this subject in recent weeks’ podcasts noting that 2021 S&P 500 estimates continue to go UP. That is not normal. Usually, in weeks leading into earnings season, estimates are taken down to lower the bar and make earnings “beats” attainable and plentiful. Not this time…
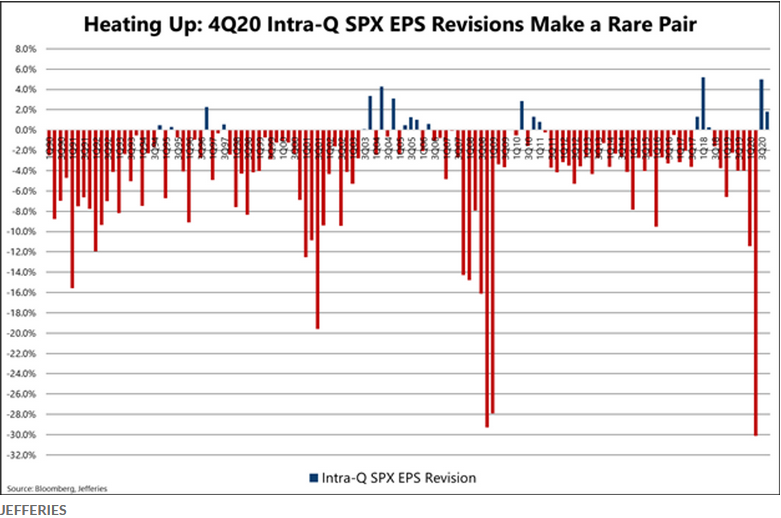
Jeffries put out a note this week that was picked up on MarketWatch: “As the table above shows, upward revisions have become a rare event. But history shows that stocks tend to follow through to the upside when they do occur, the analysts noted.”
Furthermore, “the average three-month S&P 500 outperformance in the wake of positive revisions is nearly 450 basis points, or 4.5 percentage points, ‘which bodes well’ for the S&P 500 in the first quarter of 2021 (see table below).”
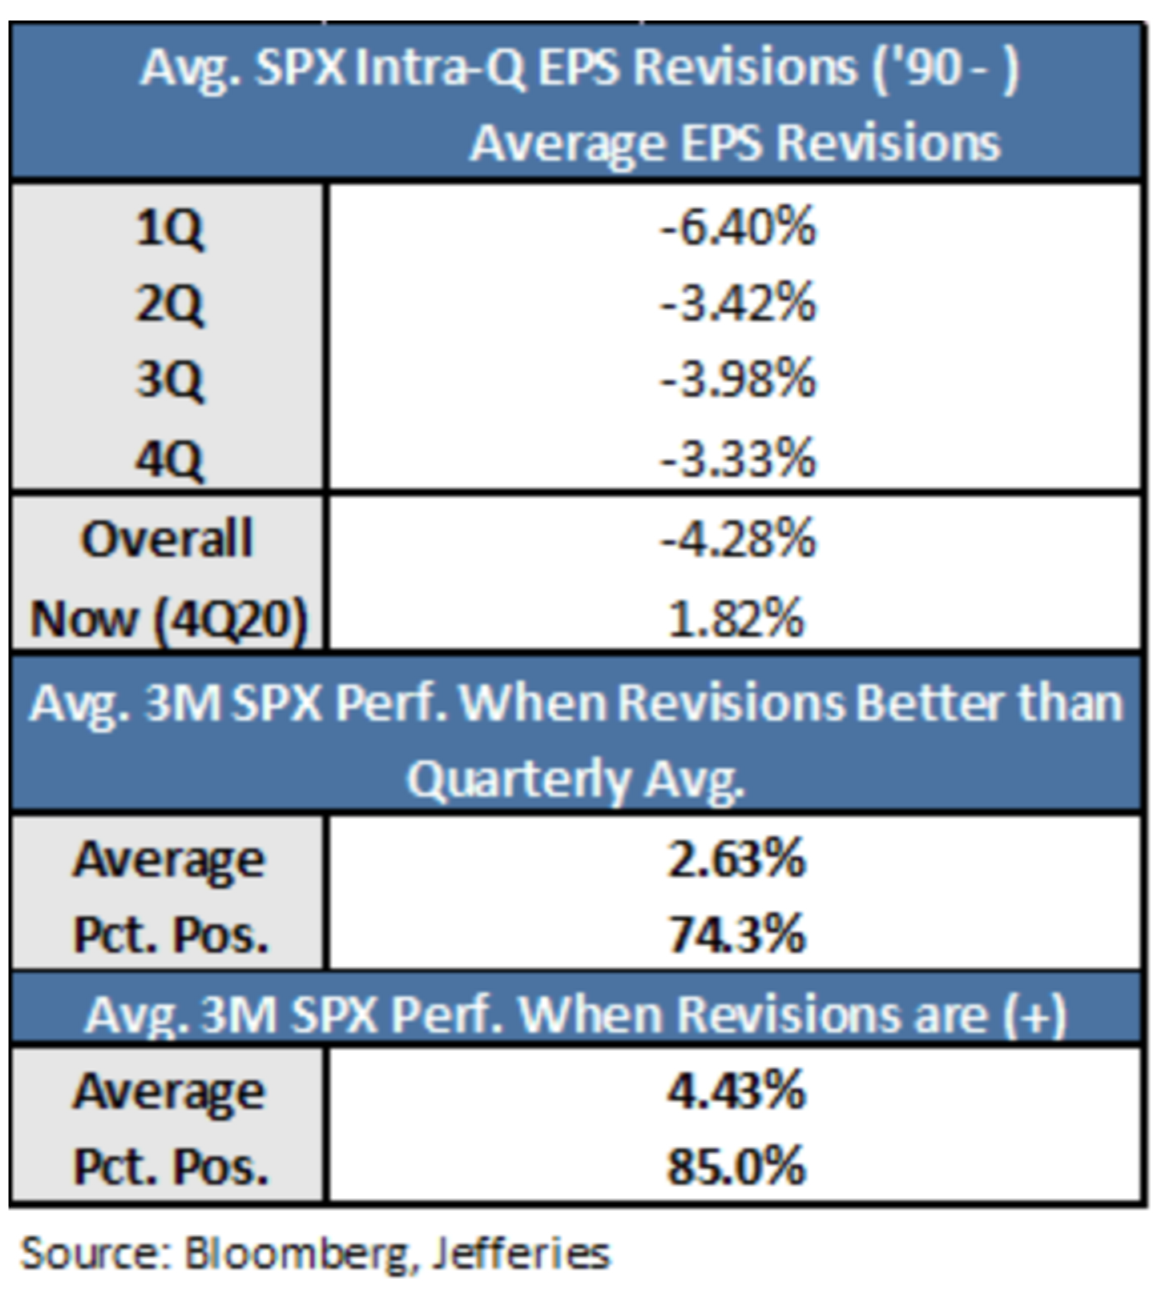
This outperformance lines up with LPL’s January “follow through” numbers pointing to a good January following strong end of years.
SKEW
I’ve covered option SKEW a number of times in previous articles, but I bring it up again because it has become elevated. This confirms what I said above – that many people are looking for the same correction. So why is it not yet evident in the Put/Call ratio or VIX?
Investopedia had a few notes I thought would be helpful on this subject – in addition to the video on our site:
“The SKEW index is calculated using S&P 500 options that measure tail risk — returns two or more standard deviations from the mean — in S&P 500 returns over the next 30 days. The primary difference between the VIX and the SKEW is that the VIX is based upon implied volatility round the at-the-money (ATM) strike price while the SKEW considers implied volatility of out-of-the-money (OTM) strikes.
SKEW values generally range from 100 to 150 where the higher the rating, the higher the perceived tail risk and chance of a black swan event. A SKEW rating of 100 means the perceived distribution of S&P 500 returns is normal and, therefore, the probability of an outlier return is small.”
So where are we now?
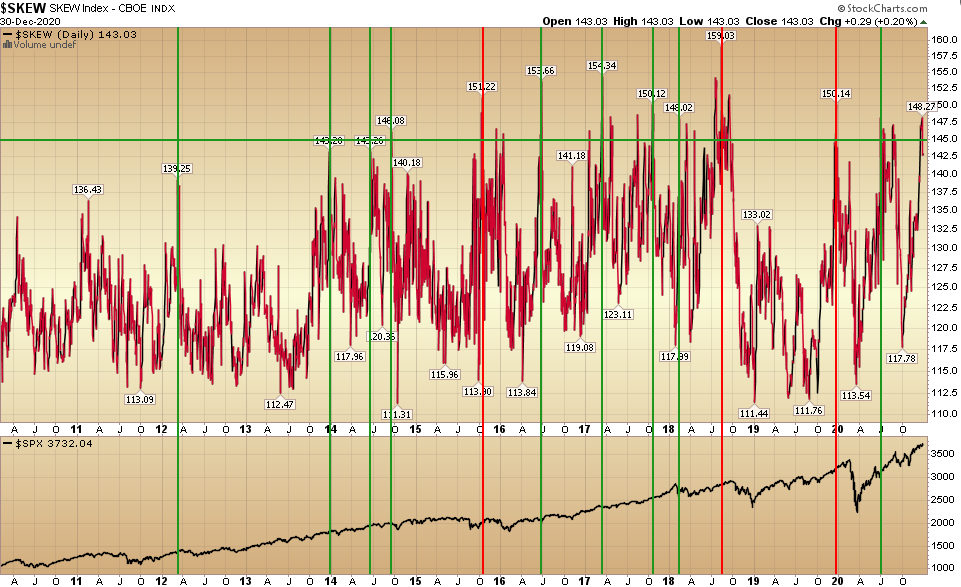
Skew is elevated – which as I stated above – means many people are betting on a “black swan” as evidenced in the pricing of 1-2SD out of the money options. I would generally prefer to be a buyer (of the general indices) when skew has collapsed following a crash – so this is not ideal.
However – if you look at the chart I annotated above you will see that elevated skew leading to meaningful corrections (>10%) are the minority. Most elevations simply lead to some sideways consolidation in an uptrend or pause that refreshes.
Also, SKEW is generally a warning shot (yellow light), not a red light – as often in those instances/signals that did lead to a large correction – the market rallied for a month+ after the “signal” before rolling over.
Charlie Bilello (who is worth a follow here and on twitter) observed data from the biggest one-day falls in the S&P 500 and the SKEW Index preceding these falls. “Going back to 1990, none of the worst declines had a SKEW Index in the prior month that was within the top 5% of historical values. So, when actual tail risk was present, SKEW did not predict it,” Bilello said.
This data makes my point, but if you changed it to two months, that conclusion would be different.
In simple terms, a warning shot has been fired, but you may not see the implications for some time and the market could continue to plod higher in the interim until time catches up and opens the trap door for the last late buyers.
For those who have been in the market, if and when we do see the consolidation/pullback (after everyone stops looking for it as some point in Q1), it will be an adding opportunity to those groups and stocks that outperform in the early stages of a new business cycle. We’re focused on Banks, Defense Stocks and Energy.
Everyone loves a good “Thrust”
So now that I’ve scared the hell out of you with SKEW, let’s wrap up with a couple of stats that should put you at ease if you take a step back:
Yahoo! Finance had a note out (by Joe Fahmy) talking about the late great Marty Zweig. My late friend Chuck Brunie (who started and ran Oppenheimer Capital and managed Milton Friedman’s money) would always talk fondly of his friend Marty over dinners with me.
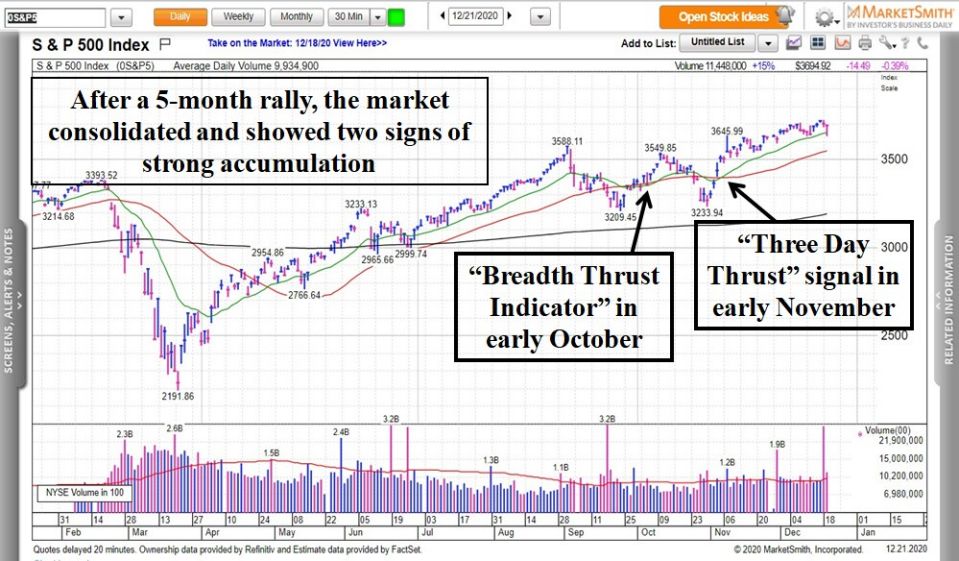
Marty invented something called the “Breadth Thrust Indicator” (see the hyperlink above for more detail). It happened in early October 2020. 32 of the last 33 times this occurred, the index was higher one year later by an average of 16%. This is also in-line with the other metrics we have shared in this article.
Then in November, the second Thrust instance came via the “Three Day Thrust” signal. This is when the S&P 500 gains at least +1.5% on three consecutive days. The other 9 times this happened since 1970 all led to strong gains with the index up +14% on average six months later and 22% on average a year later.
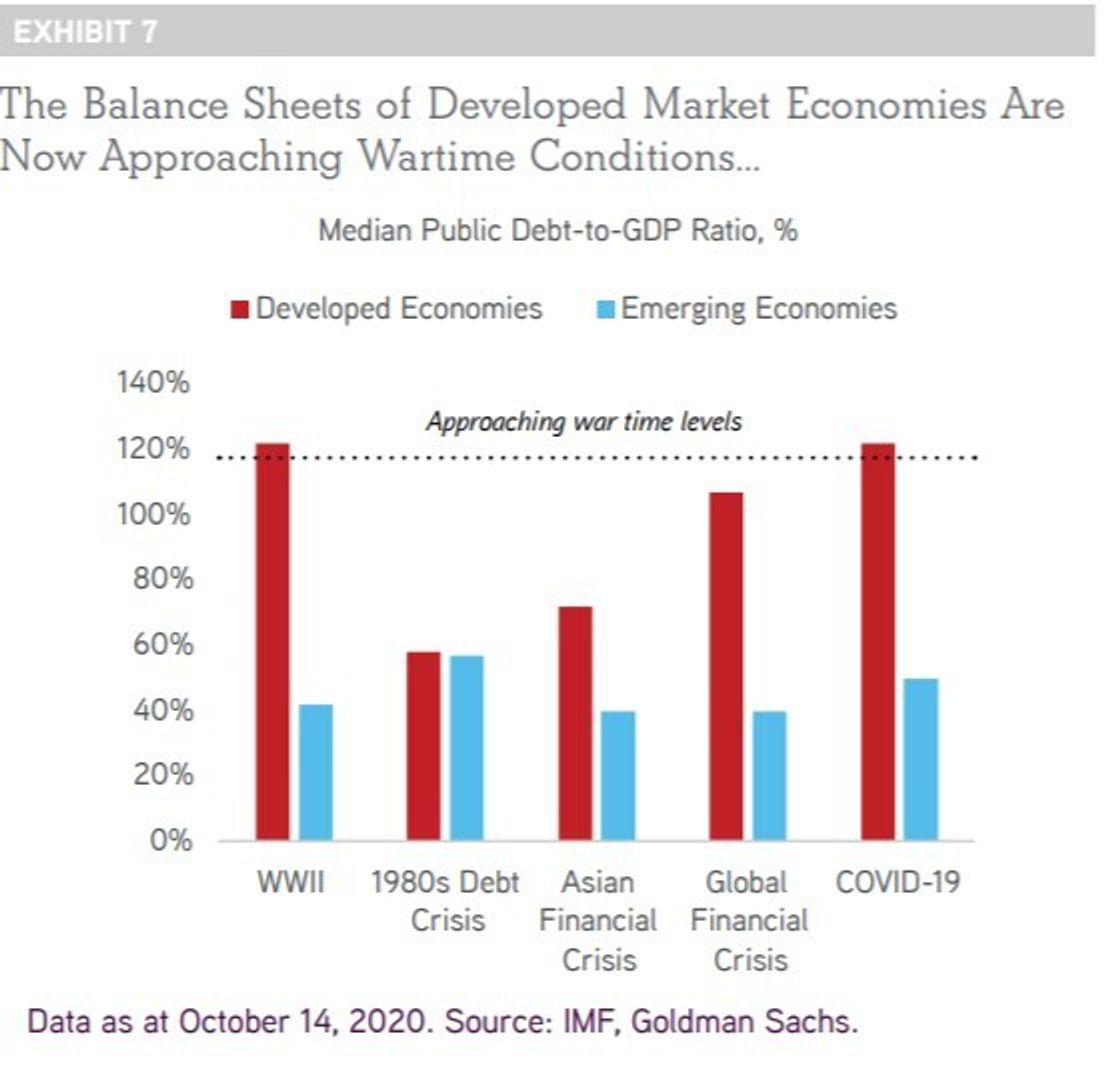
Debt
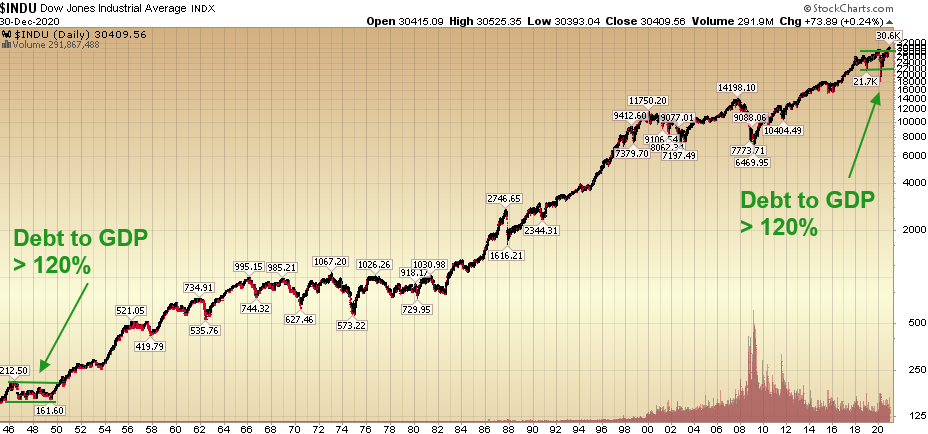
A few final words on Debt to GDP – as we are borrowing a lot of money to win the war against the “invisible enemy.”
- Our borrowing costs are low.
- Our growth will be significant coming out of this war – just as it was coming out of WWII (partially due to stimulus and partially due to 85M millennials starting families and housing formation).
- We will grow our way out – just as we did in the early 1950’s – cutting the debt/GDP ratio from 120% to the mid-60’s in a handful of years. The investment now is worth it.
Happy is as happy does…
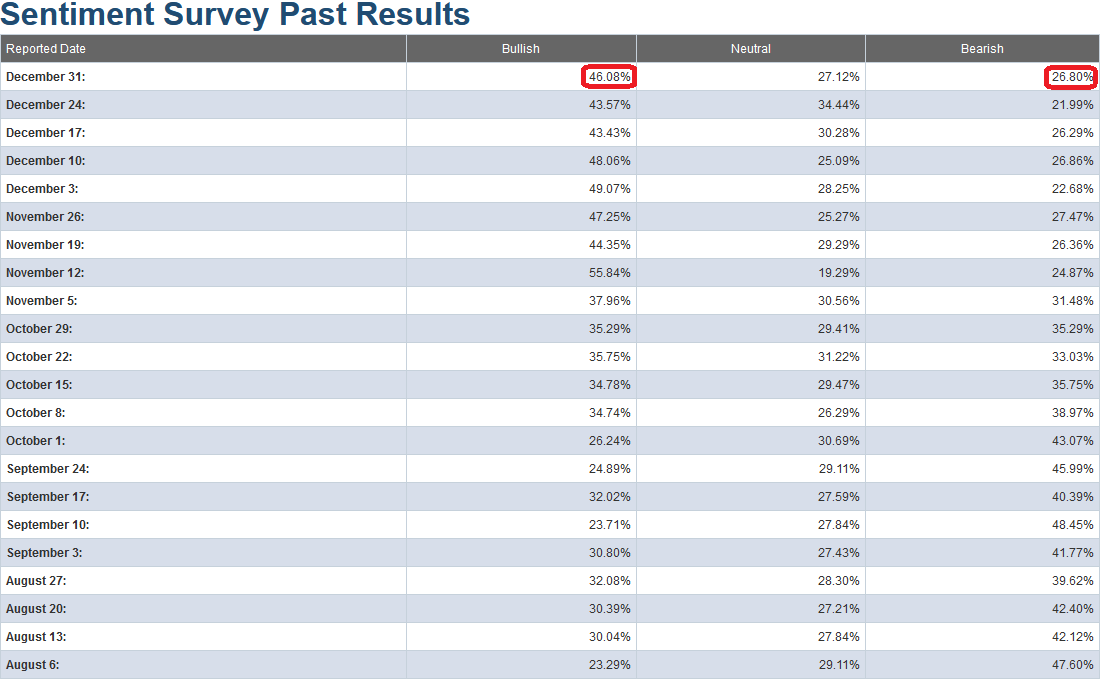
In this week’s AAII Sentiment Survey result, Bullish Percent (Video Explanation) climbed to 46.08% from 43.57% last week. Bearish Percent jumped to 26.80% from 21.99% last week. We are still at an extreme in sentiment for retail investors.
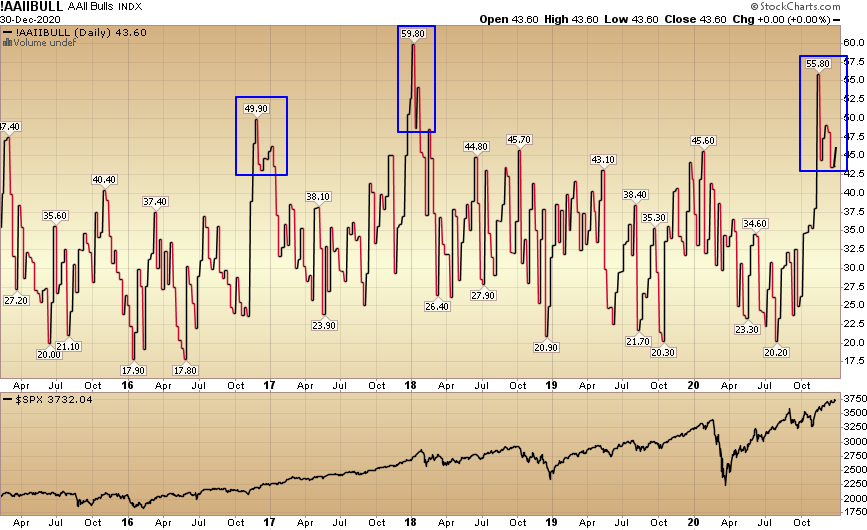
Just like last week(s) – while this is still an extreme in short-term sentiment and should be heeded in the short-term – it is important to note in the chart below, that while similar levels presaged a short term top in early 2018, they occurred near the beginning of a longer term uptrend at the end of 2016-2017 (right after the last Presidential election).
We noted the similarities between the pre-election stock-market in 2016 versus 2020 in our October 29, 2020 note. It has played out exactly according to script ever since, which is why I am inclined to give this extreme level in sentiment the same “benefit of the doubt” as late 2016.
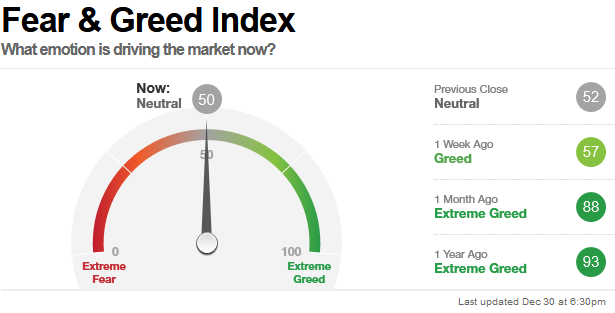
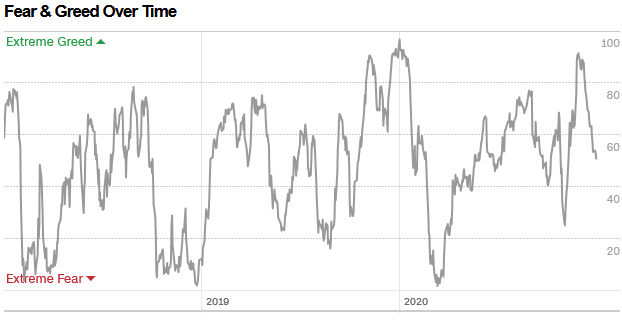
The CNN “Fear and Greed” Index dropped again from 57 last week to 50 this week. This is a neutral read. You can learn how this indicator is calculated and how it works here: (Video Explanation)
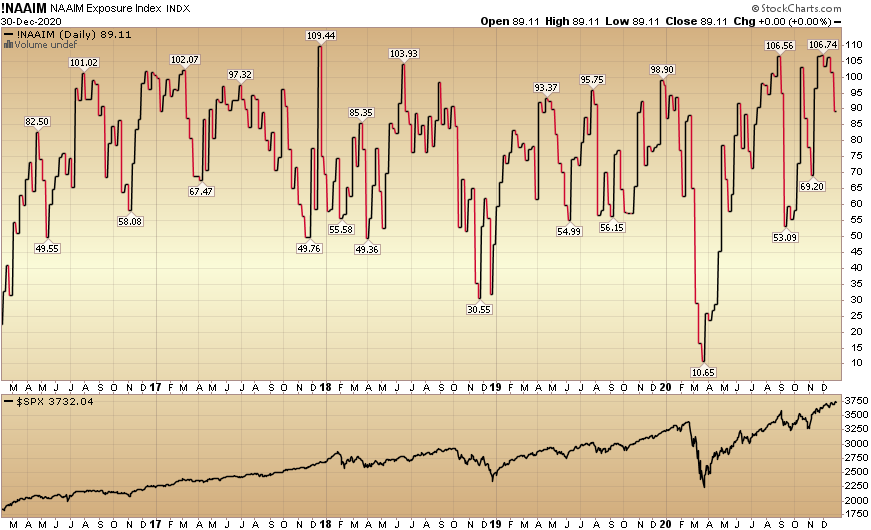
And finally, this week the NAAIM (National Association of Active Investment Managers Index) (Video Explanation) came down to 89.11% this week from 101.47% equity exposure last week.
Our message for this week:
Our view has stayed consistent.
‘While the (short-term) “easy money” has been made in the general indices (since the March lows), I think the easy money is just getting started in “left for dead” sectors/stocks. I believe Banks, Defense Stocks and pockets of Energy will be as good – if not “orders of magnitude” better (in coming quarters) – than buying the general market in late March.’
Sentiment Trader put out a stat on twitter
I think there’s a simpler reason (just follow the earnings growth):
While many worry that institutional managers – and retail investors alike – are overly confident, it just may be the case that we’ll get the anticipated correction when everyone has forgotten about the “euphoria” narrative.
While everyone’s looking for NOW, I think the odds favor a mid Q1 pullback – after most managers have given up on a correction and followed the chase. Only when everyone’s IN can they open the trap door…
AS @MacroCharts put out recently on twitter, what’s overbought, can become more overbought: Macro Charts Tweet
That said, if you take a few steps back (like we covered a few weeks ago), it may be too cute to try to play it – considering we have just started a new business cycle. There were fierce corrections in 2010 and 2011 after the huge move off the March 2009 lows.
It did not pay to play the short term moves in 2010 and 2011 – as you may very well have missed out on a decade long run. That long cycle ended with the 2019 yield curve inversion, and the 2020 ~35% correction plus 1H recession (2 quarters of negative GDP growth). The recession ended with positive GDP growth in Q3 2020 (33.4% annualized) and began the new business cycle.
We’ll be using any weakness that potentially comes our way in Q1 to add more value/cyclical names to hold for the next 3-5 years…
Disclaimer: Not investment advice. For educational purposes only: Learn more at HedgeFundTips.com.


