
The “Back To The Future” Stock Market (And Sentiment Results)

This Monday I was on Fox Business “The Claman Countdown” live while the Dow was vacillating between down ~900pts to down ~600pts. Thanks to Liz Claman and Ellie Terrett for inviting me on for the two special segments.
The key point I made in this first clip below is that we’re “Back to the Future” and the market is setting up just as it had in the week leading up to the Election in 2016 (it was down 7 consecutive days in a row). For those of you who were around in 2016, it was one of the greatest opportunities to make a large amount of money in a short period of time. Listen to the thesis and commentary here:
In 2016 all major indices were weak going into the election – just like today. What is interesting is that they bottomed on the Friday before the Election – November 4 and started to regain most of the previous week’s loss on the day before and day of the Election (before the final results were in).
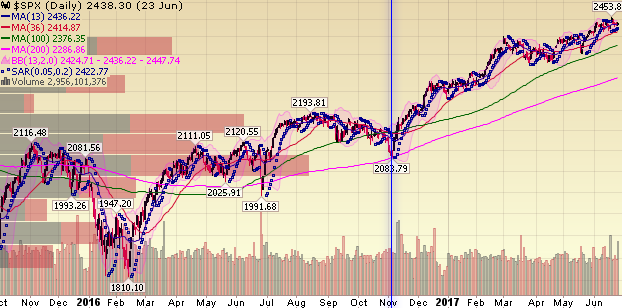
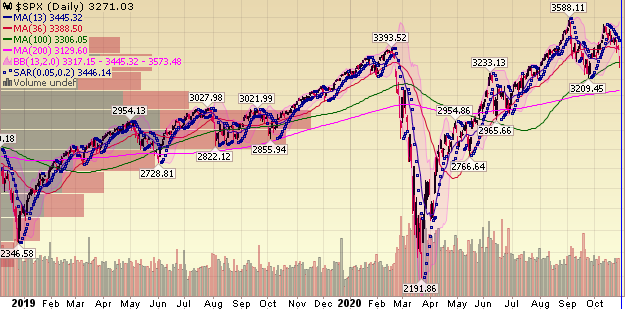
2016 vs. 2020 Election Stock Market Setup
The blue line below is the S&P 500 (SPX) on November 4, 2016 (the Friday before the Election – which took place on Tuesday, November 8):
The blue line is the S&P 500 on October 28, 2020 (the Wednesday before the Election – which takes place on Tuesday, November 3):
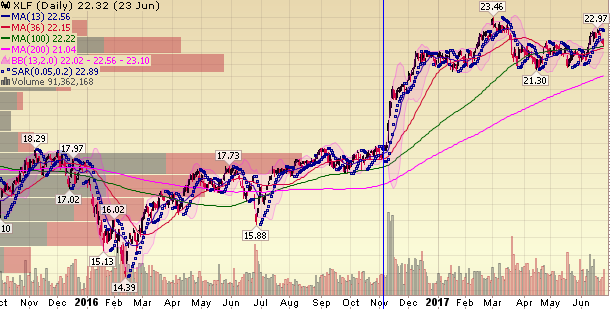
What is more important than the indices weakness into the 2016 election is the specific Sectors and Stocks that were the strongest coming out.
The blue line below is the XLF – Financials Sector ETF (XLF) on November 4, 2016 (the Friday before the Election – which took place on Tuesday, November 8):
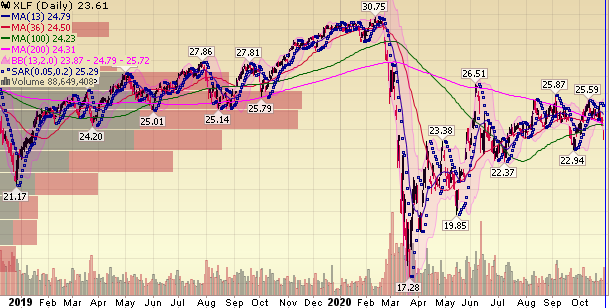
The blue line is the XLF – Financials Sector ETF on October 28, 2020 (the Wednesday before the Election – which takes place on Tuesday, November 3):
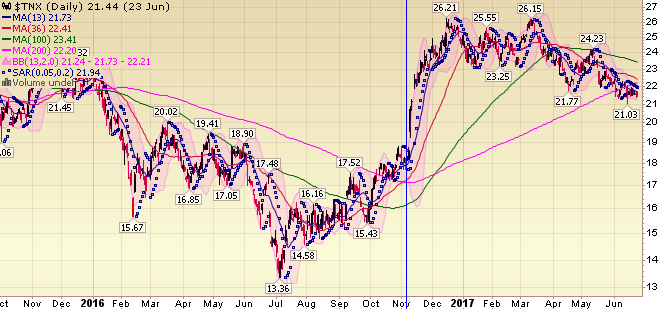
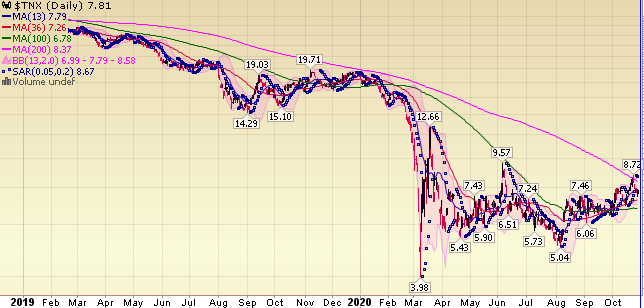
A similar story on the 10-yr yield (key for Banks):
The blue line below is the Ten Year Treasury Yield on November 4, 2016 (the Friday before the Election – which took place on Tuesday, November 8):
The blue line is the Ten Year Treasury Yield on October 28, 2020 (the Wednesday before the Election – which takes place on Tuesday, November 3):
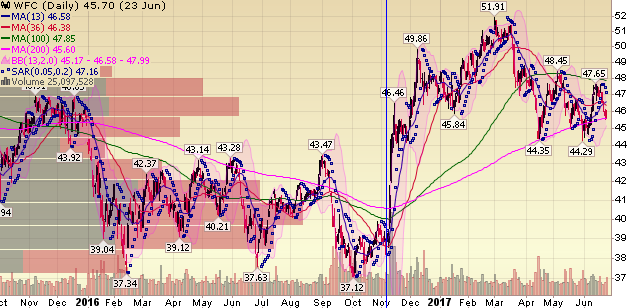
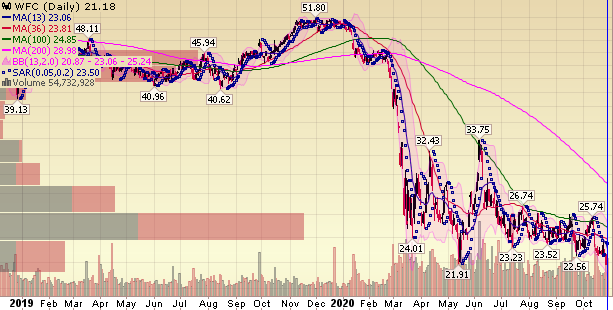
A similar story on Wells Fargo (WFC):
The blue line below is Wells Fargo (WFC) on November 4, 2016 (the Friday before the Election – which took place on Tuesday, November 8):
The blue line is Wells Fargo (WFC) on October 28, 2020 (the Wednesday before the Election – which takes place on Tuesday, November 3):
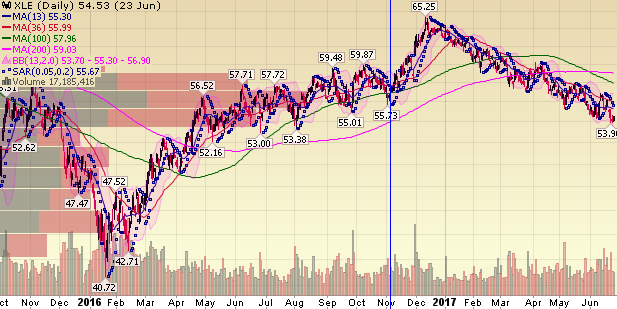
Now onto another hated sector - Energy:
The blue line below is the XLE – Energy Sector ETF (XLE) on November 4, 2016 (the Friday before the Election – which took place on Tuesday, November 8):
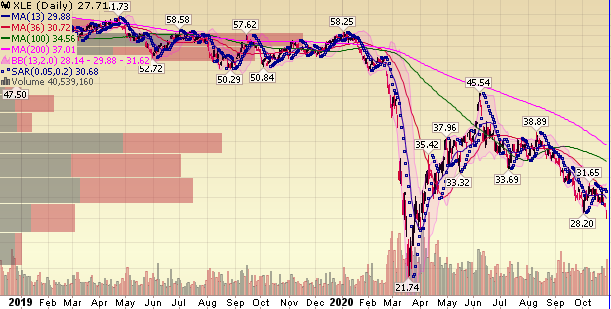
The blue line is the XLE – Energy Sector ETF on October 28, 2020 (the Wednesday before the Election – which takes place on Tuesday, November 3):
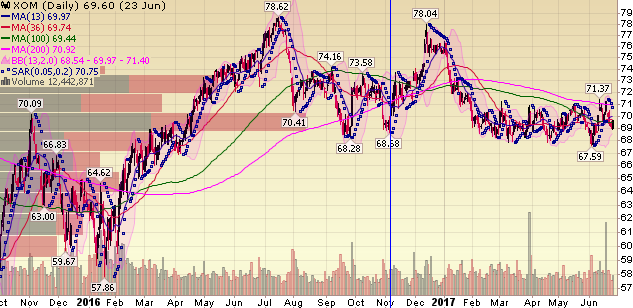
The blue line below is Exxon Mobil (XOM) on November 4, 2016 (the Friday before the Election – which took place on Tuesday, November 8):
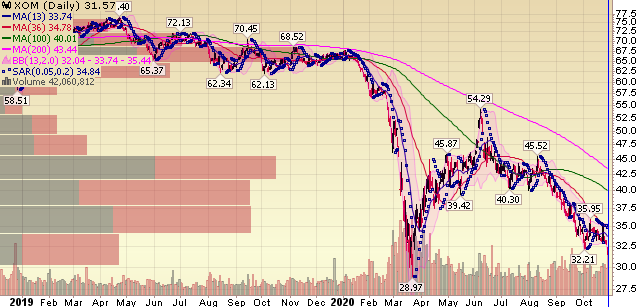
The blue line is Exxon Mobil (XOM) on October 28, 2020 (the Wednesday before the Election – which takes place on Tuesday, November 3):
What about “Left Behind” Defense Stocks?
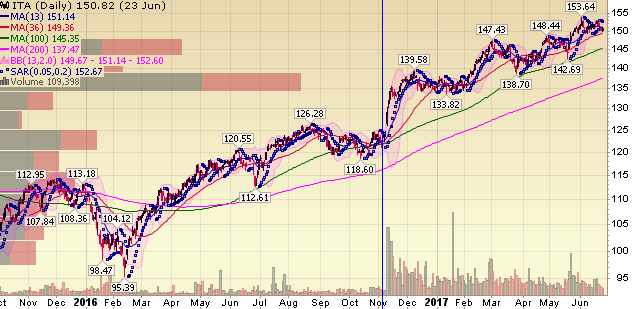
The blue line below is the ITA – Defense Sector ETF (ITA) on November 4, 2016 (the Friday before the Election – which took place on Tuesday, November 8):
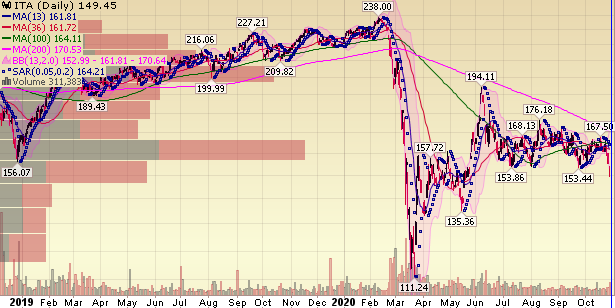
The blue line is the ITA – Defense Sector ETF on October 28, 2020 (the Wednesday before the Election – which takes place on Tuesday, November 3):
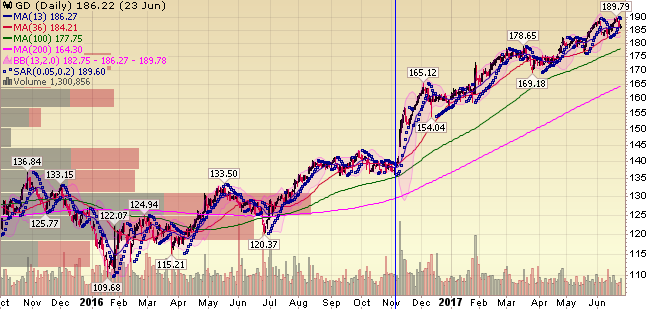
The blue line below is General Dynamics (GD) on November 4, 2016 (the Friday before the Election – which took place on Tuesday, November 8):
The blue line is General Dynamics (GD) on October 28, 2020 (the Wednesday before the Election – which takes place on Tuesday, November 3):
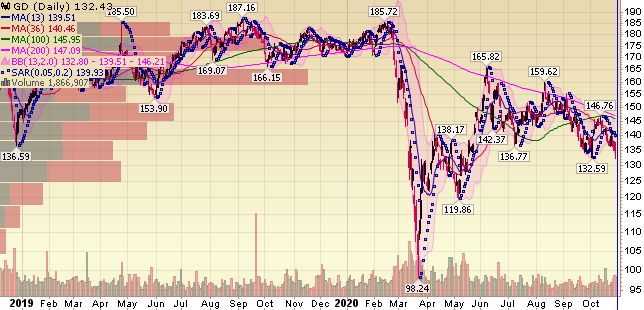
As I said on Monday with Liz Claman, the weakness this week (in those “left behind” sectors) may be a great opportunity to add high-quality names into the election. See the video for the groups to consider. We own, added, and continue to add Banks, Defense Stocks and Energy – at the margins – on any down days this week.
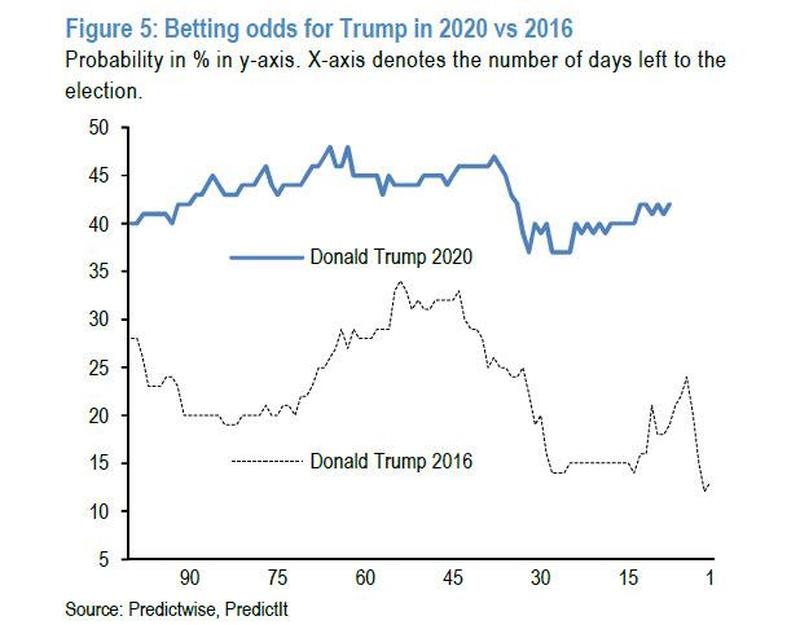
What is also uncanny with regard to the same/similar sectors/stocks showing weakness into the election is the “betting odds” for the Presidency. In other words, the sectors that are currently weak – anticipating a Biden (or in the case of 2016 – Clinton) Presidency are the same ones that immediately EXPLODED/(may explode) higher in the next few weeks and months into Q1 (2017/2021).
As I have been noting in past (VideoCasts) and (Podcasts), President Trump’s poll numbers haven’t been this bad since:
The night he won the Election in 2016…
That does not mean bad polls = good election results. I’m certain he would prefer a “surer” outcome, but as market participants (not political commentators) we have to be prepared for every eventuality. The way this market is setting up (so similarly to 2016), we have to at least consider the possibility that an upset is in the offing.
Looking at the charts above (and related fundamental factors we have covered in recent weeks), these sectors/stocks are set up for a major bounce/rally off of extremely depressed and “oversold levels.” What makes it interesting is that if you think about the “consensus” “priced-in” “blue-wave” outcome, it does not sync with these stocks and sectors rallying off the lows. However, if we took the same inputs with no election filter – we could clearly make the case.
What does this tell us?
Maybe nothing, but maybe everything. Meaning, if these stocks/sectors are set-up to bounce/rally – and a Blue-Wave would have the opposite effect on these particular stocks and sectors – perhaps it is presumptive to expect a blue-wave.
JP Morgan put out a note earlier this week showing the betting odds in 2020 relative to the betting odds in 2016 (we have covered this many times in the past few weeks and months). As we stated above, his odds are much higher at this point than they were in 2016 (at this exact point in time):
One other factor worth keeping an eye on is Kanye West. We were very early to this story in our notes over the Summer, but very few have been paying attention to the fact that he is now on 12 ballots: Arkansas, Colorado, Idaho, Iowa, Kentucky, Louisiana, Minnesota, Mississippi, Oklahoma, Tennessee, Utah, Vermont.
Minnesota and Colorado are key swing states where 5,000-10,000 votes could make all of the difference. The other key factor to keep in mind is that he has been instructing his followers and fans on Twitter to WRITE IN HIS NAME IN STATES WHERE HE IS NOT ON THE BALLOT – so his impact may prove to be much greater than anyone is calculating. As I stated in one of the podcasts over the Summer, “he didn’t become a billionaire selling sneakers because no one likes him.”

JP Morgan also did a similar study to my notes above about which sectors did best immediately following the Trump Victory. Summary: Financials did the best, Tech and Consumer Staples under-performed the market:
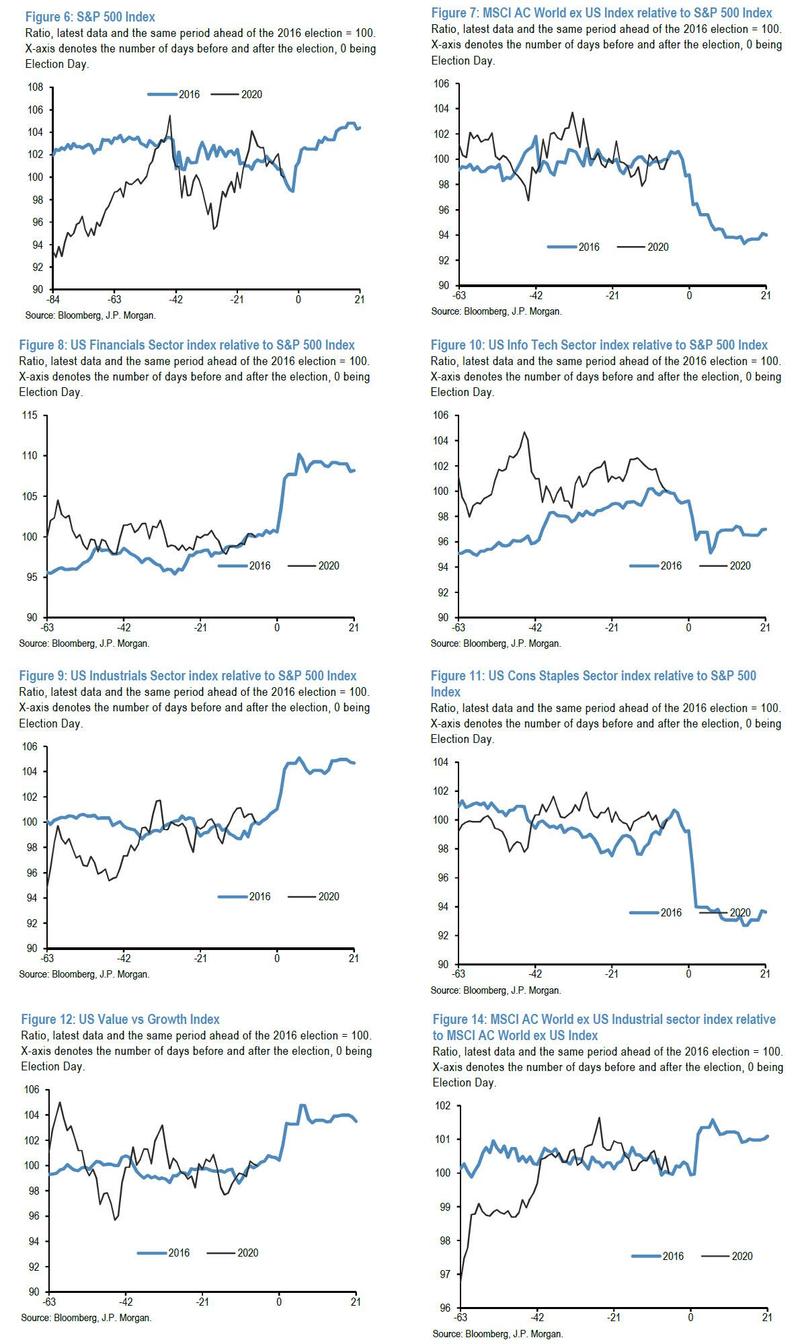
Source: JPM via ZeroHedge
Billionaire “Bond King” Jeffrey Gundlach (who predicted Trump’s victory in 2016) is predicting the same outcome in 2020 (ZeroHedge)
Tech’s expected under-performance (which would be harder to fathom in the event of Blue Wave), falls in line with the recent overhang regarding Section 230 and Anti-Trust action against Big-Tech. The Justice Department has signaled that recent legal action against GOOGL is only the first action of many to come from their 16-month investigation.
SocGen pointed out that this week that while US Tech’s PRICE relative to the overall market has continued to improve, it’s earnings per share estimates relative to the overall market have started to drop:
(Click on image to enlarge)
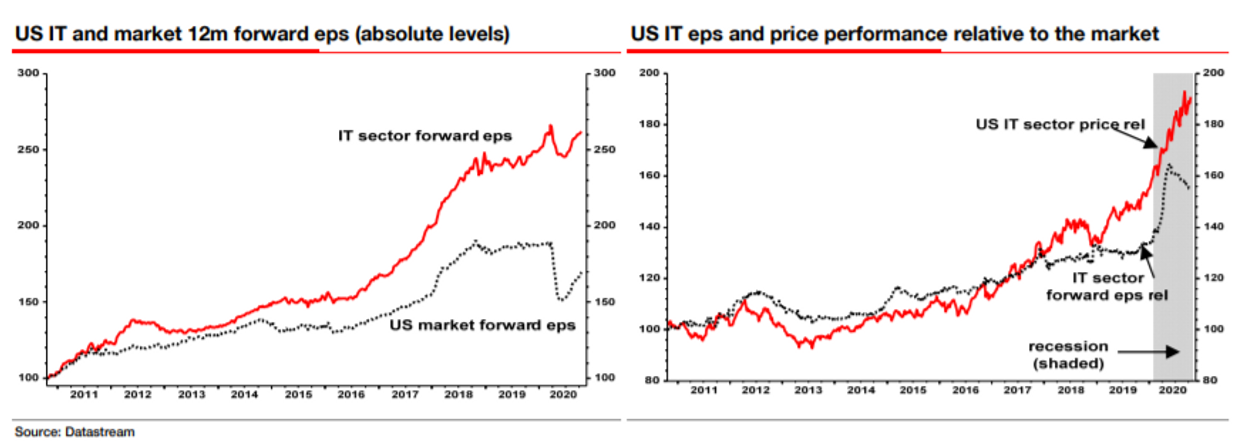
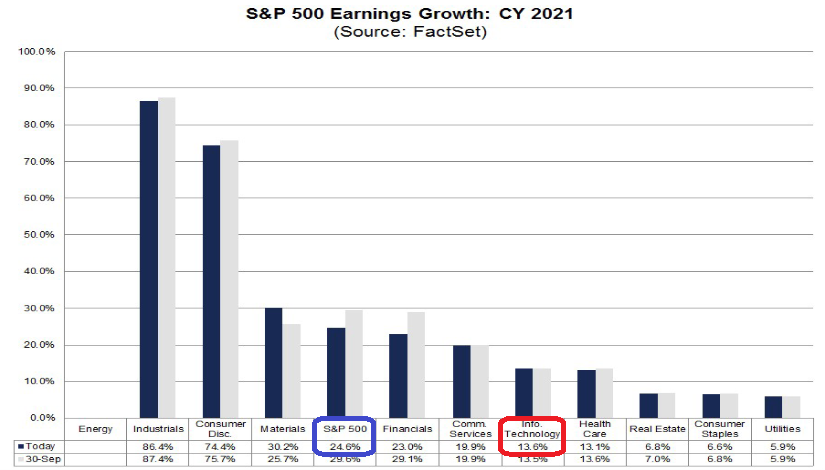
Put more simply, Info Tech is expected to grow earnings at approximately half as fast as the S&P 500 in 2021. In other words, BUY NOW and you can have half the growth rate for nearly 2x the price (multiple)! ***Just pay processing and handling…
(Click on image to enlarge)
Tech’s share of valuation continues to consume an abnormally high share of overall market valuation. History has a tendency to moderate such aberrations (in the coming months and years – Congress and the DOJ may wind up doing history’s work):
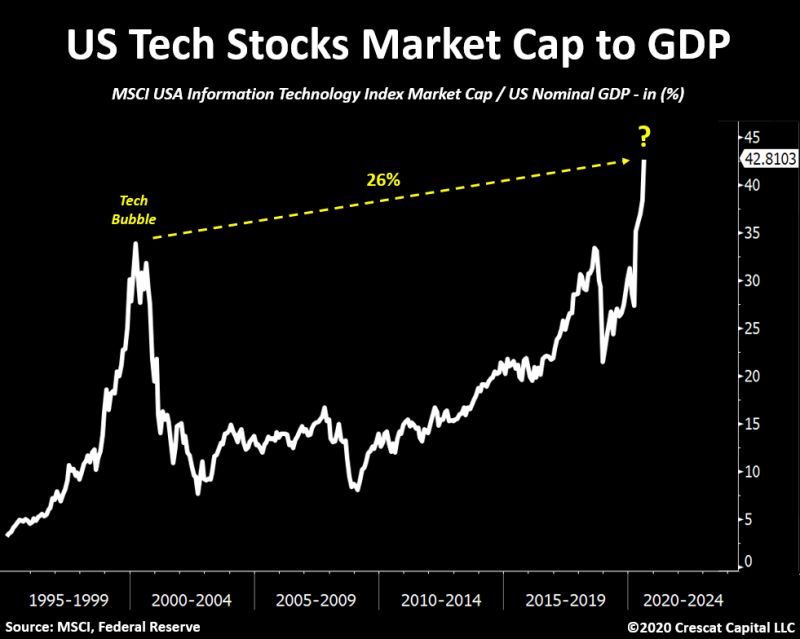
Source: Crescat
Now onto the shorter-term view for General Market:
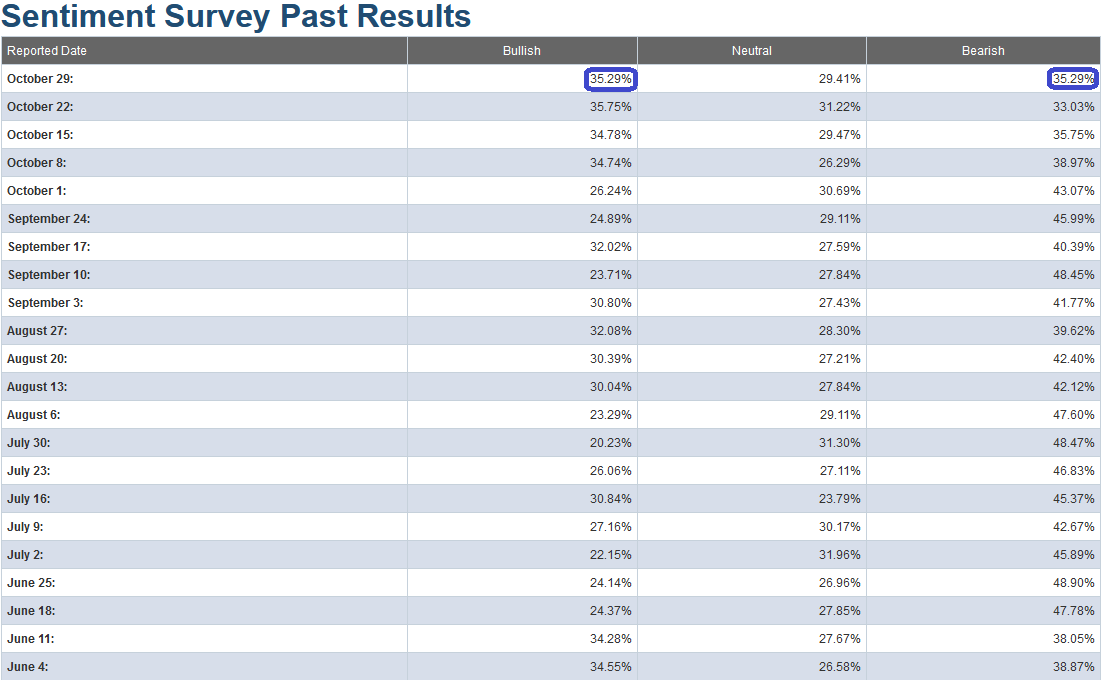
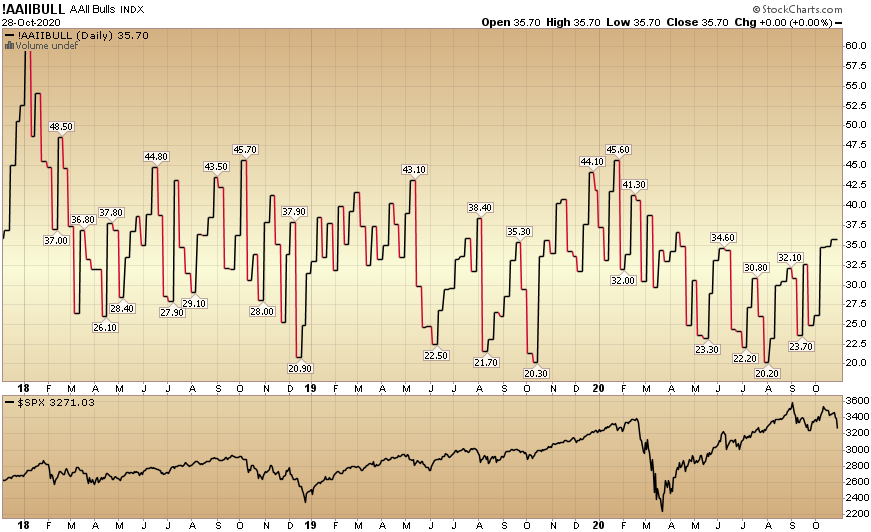
In this week’s AAII Sentiment Survey result, Bullish Percent (Video Explanation) flat-lined 35.29% to from 35.75% last week. Bearish Percent increased to 35.29% from 33.03% last week. This is a surprisingly bullish read considering the market action this week.
(Click on image to enlarge)
(Click on image to enlarge)
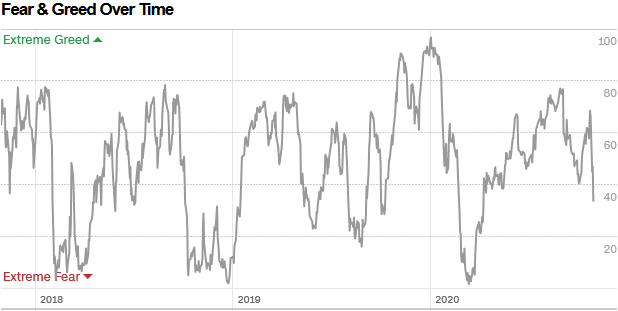
The CNN “Fear and Greed” Index dropped from 63 last week to 37 this week. Fear has crept back into the market. You can learn how this indicator is calculated and how it works here: (Video Explanation)
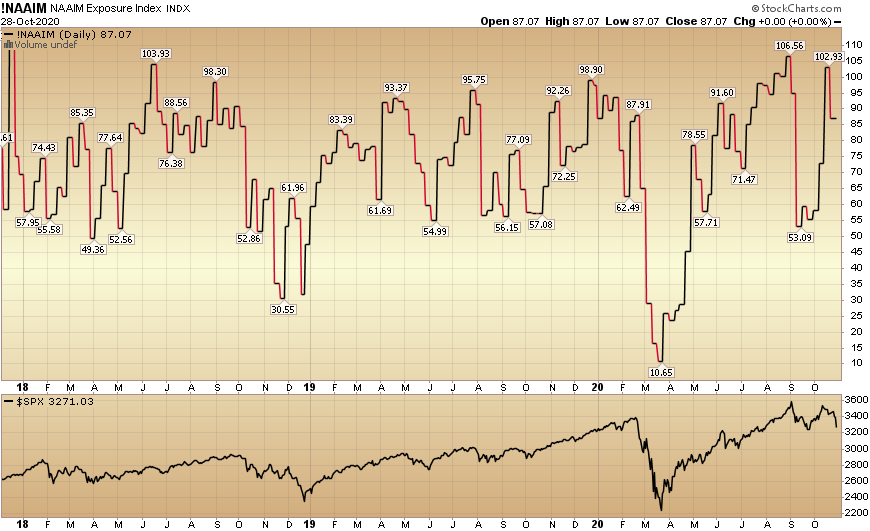
And finally, this week the NAAIM (National Association of Active Investment Managers Index) (Video Explanation) dropped to 87.07% this week from 102.93% equity exposure last week. Fear has crept in.
(Click on image to enlarge)
Our message for this week:
As I have emphasized for over a month, the catalyst for change (a continuation of the move into Cyclicals) will likely come from science at this point. Don’t bet against science. Every day that passes we are closer to waking up to an approved vaccine or new treatment.
In the meantime, remaining Big Tech Earnings (and the Election) are the key data points coming this week. If the set-ups above are correct, we could see a number of “left for dead” stocks and sectors take on a brand new life in a short period of time.
Like 2016, I think the “Election Jitters” and short term volatility will prove to be a major opportunity this week – versus something to fear. Time will tell…
Disclaimer: Not investment advice. For educational purposes only: Learn more at HedgeFundTips.com.


