
Inflation in the European Union is nearing 2%, expected to dip below it in 2026 and 2027 and then settle at its 2% target thereafter. The ECB’s President Lagarde and other ECB members have recently stated that they are comfortable with the central bank’s current interest rate level. The markets are taking the ECB’s public posture as a signal that the 2% in rate cuts over the last two years is likely over.
Why should American investors care? The simple answer is that ECB and Fed policies are often closely aligned because of the interconnectedness of monetary policy, global economic and inflation trends, and financial stability. Interest rate and monetary policy divergences arise when regional growth, fiscal dynamics, and/or financial stress differ between economic regions. However, while gaps do occur, sustained policy gaps are rare because large interest-rate differentials can destabilize currencies and alter capital flows. Simply put, changes in currency exchange rates due to interest rate differentials bring the economies and interest rates back into balance. Thus ECB and Fed policy rates are most often aligned.
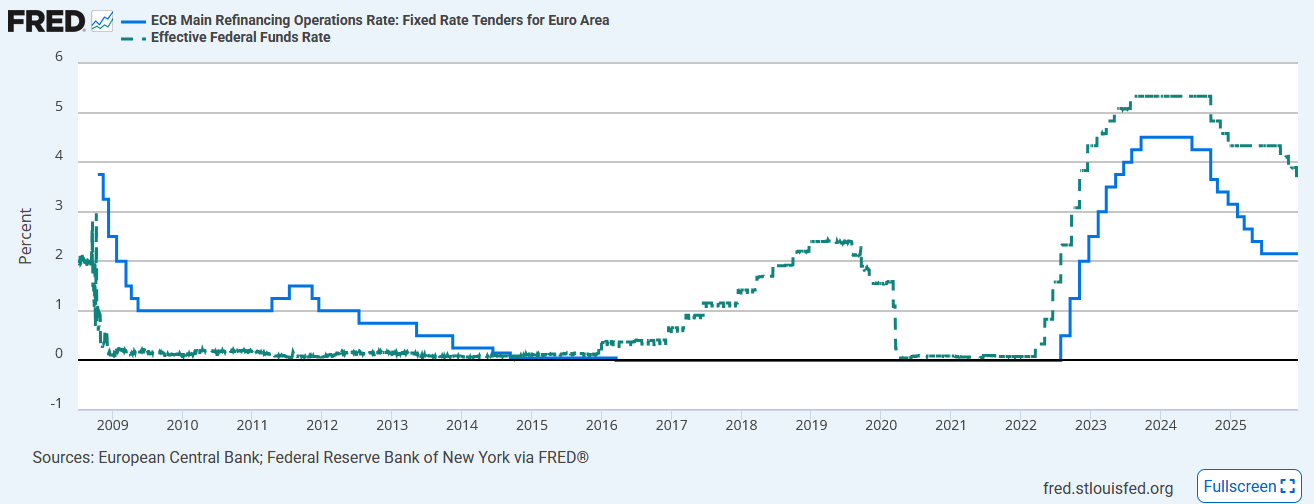
Therefore, if the ECB is truly done cutting rates, the Fed may not be that far behind. If the Fed were to continue cutting, the dollar could weaken further, which might force the ECB to resume policy easing. As shown in the graph below, there is a good relationship between the European Central Bank’s (ECB) overnight borrowing rate and the Federal Reserve’s Fed Funds rate.
What To Watch Today
Earnings
- No earnings releases today
Economy
(Click on image to enlarge)

Market Trading Update
Yesterday, we reviewed the technical backdrop of the market as we enter the low-volume holiday trading period. Of note, over the weekend, I read several articles discussing how the recent market performance was evidence that “Santa Claus would fail to visit Broad & Wall.” While nothing is guaranteed, I found the articles interesting in that the “Santa Claus” rally has not even started yet. The official start date (the last five trading days of December) is December 24th (albeit it is only a half day) and continues through the second trading day of January.
It is worth noting that in both 2023 and 2024, the “Santa Rally” failed to materialize, but certainly did not live up to its forecast of a poor return year. It has been anything but over the last two years. Nonetheless, given that Santa failed to visit in the previous two years, it ups the odds he will arrive on time this year. As shown, going back to 1950, there have never been three consecutive “no shows” by the man in red.
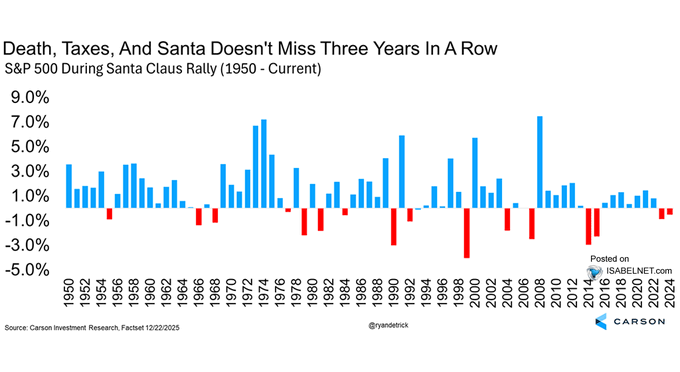
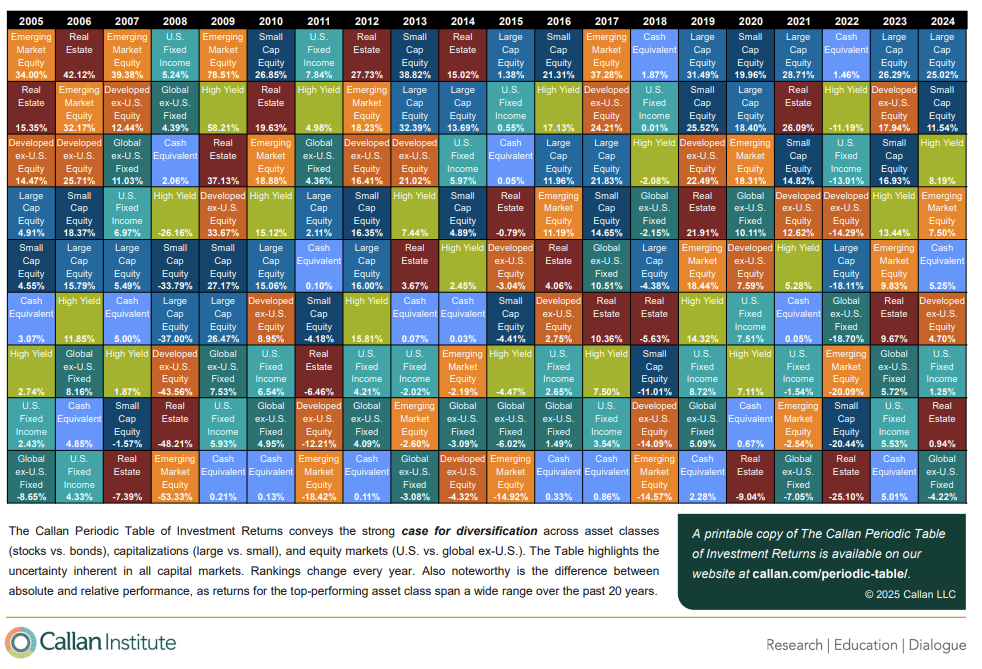
Nonetheless, 2025 could be the “first” triple no-show on record. As such, investors should remain focused on the risk they are taking. This brings up one other important point to consider: don’t chase last year’s performers. One of the biggest mistakes that investors make is assuming that what worked last year will work next year. As the Callan Period Table of Investment Returns shows, that is rarely the case. What was at the top of the performance heap for a year or two tends to revert towards the bottom, and vice versa.
(Click on image to enlarge)
One thing to consider in your portfolio as we wrap up the year and look into next is where performance may come from. A rotation from risk to safety, growth to value, momentum to income, etc. are all considerations as 2025 comes to a close.
Trade accordingly.
Visualizing Rotations
On Tuesdays, we often recap our SimpleVisor absolute and relative valuations for sectors and factors. We do this to help our readers understand how various sectors and factors constantly shift from overbought to fair value to oversold. Typically, most sectors and factors follow a jagged path between these three valuation states. Today, we focus on the SimpleVisor graph charting rotations between these states.
The table on the left shows that the Utilities sector has moderately oversold absolute and relative scores. To calculate these scores, we use 13 technical indicators and a weighted scoring system based on their relative importance. The absolute score uses the sector’s price and technical indicators to produce a score ranging from -1.0 to +1.0. The relative indicator uses the same technical indicators and weightings but applies them to the price ratio of the sector to the S&P 500.
The graph on the right side shows how absolute and relative scores shift over time. We use dark blue arrows to better illustrate how utilities have moved between overbought and oversold levels over the past 11 weeks. Initially, Utilities were very overbought on an absolute basis and at fair value on a relative basis. From there, the relative score rose. After peaking, both scores deteriorated until mid-December. Note that during this period of underperformance, the sector spent a few weeks noodling around at fair value in the middle of the graph. Afterward, it has become very oversold on both bases. Since then, the relative score has improved a little. We suspect it is heading toward fair value, implying it will slightly outperform the market while showing improving technicals.
(Click on image to enlarge)

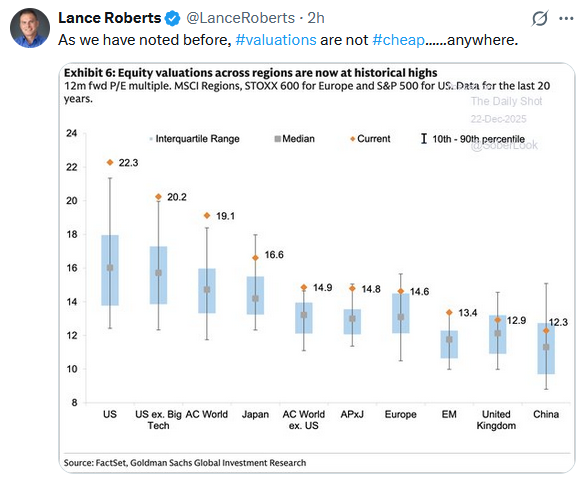
2026 Market Outlook Based On Valuations
Wall Street’s annual tradition is always of higher returns. To borrow a quote:
“(Market) Predictions Are Difficult…Especially When They Are About The Future” – Niels Bohr
Okay, I took a little poetic license, but the point is that while we try, predicting the future is difficult at best and impossible at worst. If we could accurately predict the future, fortune tellers would win all the lotteries, psychics would be more prosperous than Elon Musk, and portfolio managers would always beat the index.
However, this is never the case, and as investors, we must rely on our data, analyze past events, filter out the current noise, and discern possible future outcomes. The biggest problem with Wall Street today and in the past is its consistent disregard for the unexpected and random events that inevitably occur, like the “Liberation Day” tariff event that sent the market plunging by nearly 20%. However, even when such events occur frequently, from trade wars to Brexit to Fed policy and a global pandemic, Wall Street analysts were often convinced that such things would not happen.
So what about 2026? We have some early indications of Wall Street targets for the S&P 500 index, and, as is always the case, they are primarily optimistic for the coming year. The median estimate for 2026 is for the market to rise to 7500 next year, which would be a disappointing return of just 9.3% after three years of 20% gains. However, the high estimate from Deutsche Bank suggests a 15% return, while the low estimate from BofA is just 4%. Notably, not one firm forecasts a negative return.

Tweet of the Day
More By This Author:
2026 Market Outlook Based On ValuationsThe Seen And The Unseen Of QE-RMP
Fed’s Soft Landing Narrative Meets Economic Data


Comments
Log in or sign up to join the conversation.