
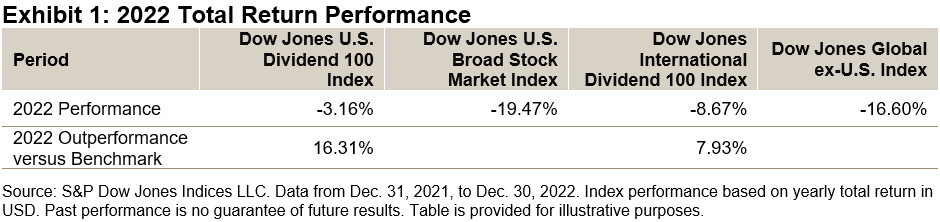
Looking back, 2022 was an impressive year for passive dividend indices, both with respect to performance and inflows on the back of rising interest rates. The Dow Jones U.S. Dividend 100 Index and Dow Jones International Dividend 100 Index were two of the standout performers, which may be due to their emphasis on strong fundamentals and robust dividend payments.
(Click on image to enlarge)
In this blog, we will examine the two indices’ focus on dividend sustainability and quality as well as review their historical performance and dividend yields. In a subsequent blog, we will analyze their fundamentals and provide back-tested historical simulations combining the U.S. and international versions for those wishing to see the benefits of diversification.
Stringent Fundamental Screening
Both Dow Jones Dividend Indices use stringent fundamental screening when selecting constituents. In fact, multiple screens are applied, including value, growth and, most extensively, quality (there is also a low volatility screen applied to the international version).
Their methodologies begin by including only companies that have paid dividends for at least 10 consecutive years. Stocks are then ranked by indicated annualized dividend (IAD) yield, with those below the eligible median stock’s IAD yield being removed.
(Click on image to enlarge)
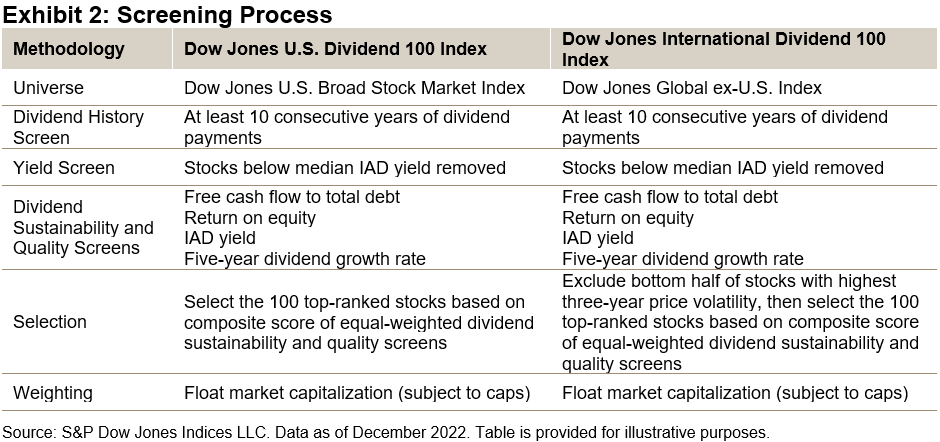
Next, the 100 top-ranked stocks are selected based on their equal-weighted composite score consisting of free cash flow (FCF) to total debt, return on equity (ROE), IAD yield and five-year dividend growth rate. The Dow Jones International Dividend 100 Index includes an additional step of filtering out the bottom half of stocks with the highest three-year price volatility. Lastly, both indices weight constituents quarterly, using a float-market-capitalization approach (subject to weight caps).
This emphasis on multi-factor screening is unique and leads to superior fundamental metrics versus their benchmarks, which we will examine in part two of this blog series. Specifically, quality measures such as FCF to total debt and ROE are important. FCF to total debt measures how long it will take a company to repay its debt using solely its free cash flow, and ROE measures how efficiently a company employs shareholder capital to generate profits.
Performance
Over the long term, Exhibit 3 shows that the Dow Jones Dividend 100 Indices generated significantly higher risk-adjusted returns over the full back-tested period versus their respective benchmarks. Both achieved this by generating higher absolute returns while also exhibiting less volatility. The max drawdowns were also improved, by over 6% for the Dow Jones U.S Dividend 100 Index and over 7% for the Dow Jones International Dividend 100 Index.
(Click on image to enlarge)
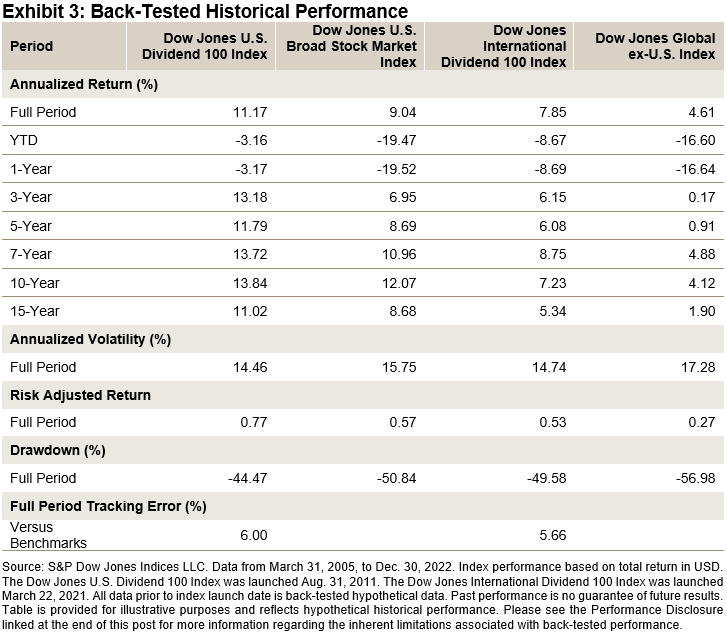
Exhibit 4 displays the outperformance of both Dow Jones Dividend 100 Indices versus their respective benchmarks in periods when the year-over-year CPI rate exceeded 3% for at least six consecutive months. Both indices significantly outperformed their respective benchmarks in the three most severe inflationary periods dating back to 2005. During the current inflationary period, the Dow Jones U.S. Dividend 100 Index and Dow Jones International Dividend 100 Index have outperformed their respective benchmarks by 14.81% and 12.02%, respectively.
(Click on image to enlarge)
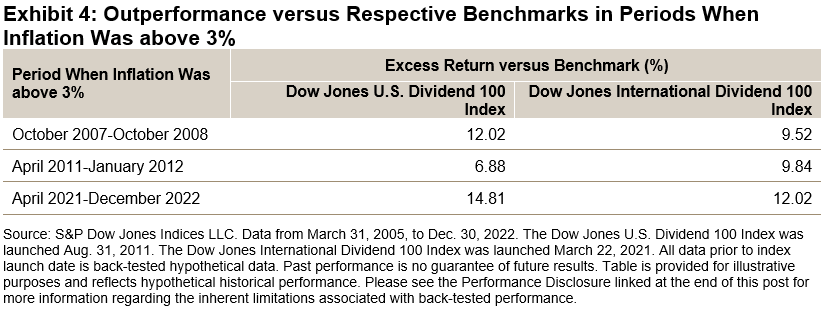
Exhibit 4 displays the outperformance of both Dow Jones Dividend 100 Indices versus their respective benchmarks in periods when the year-over-year CPI rate exceeded 3% for at least six consecutive months. Both indices significantly outperformed their respective benchmarks in the three most severe inflationary periods dating back to 2005. During the current inflationary period, the Dow Jones U.S. Dividend 100 Index and Dow Jones International Dividend 100 Index have outperformed their respective benchmarks by 14.81% and 12.02%, respectively.
(Click on image to enlarge)
Conclusion
The Dow Jones U.S. Dividend 100 Index and Dow Jones International Dividend 100 Index have performed well relative to their benchmarks in 2022, in an economic environment affected by rapidly rising interest rates, increasing geopolitical risks and slowing economic growth. Stay tuned for part two of this blog series, where we will analyze the fundamentals of these two indices and examine hypothetical portfolios that combine them.
More By This Author:
Latin American Equities Outperformed Global Regions In 2022
The Key To The S&P 500 ESG Index’s Outperformance: Avoiding The “Worst”
Global Islamic Indices Declined Over 20% YTD, Underperforming Conventional Benchmarks In 2022


Comments
Log in or sign up to join the conversation.