
The Comprehensive Guide To The Zebra Strategy
This is a comprehensive guide to the ZEBRA strategy.
Starting from the origin of the term to the basic setup of the ZEBRA, we will then deep dive into probability cones, risk-reward ratios, the Greeks, breakeven calculations, extrinsic values, and even measuring the angles of the expiration line — the whole works.
Introduction
The ZEBRA is a stock replacement strategy, among the other stock replacement strategies such as the synthetic long stock, risk reversal, and LEAPS.
ZEBRA stands for Zero Extrinsic Back Ratio, a term coined by Liz and Jenny in their TastyTrade show.
As the name implies, it is just a back ratio spread, which is covered more in-depth in another article.
However, the strikes are selected in such a way that it mimics a stock, but with less capital and with defined risk.
The strikes are selected to wash out extrinsic value, which gives it an advantage over just buying a call or a put.
Trade Setup
Buy two 70-delta in-the-money options.
Sell one 50-delta at-the-money option.
Use all calls if going long.
Use all puts if going short.
An example of going long would be:
Date: Dec 21, 2020
Price: AAPL @ $128.23
Sell one AAPL Jan 15, 2021 – $128 call @ $4.925 (at delta=53) (25 days till expiration)
Buy two AAPL Jan 15, 2021 – $122 call @ $8.55 (at delta=71)
Net Debit: $1217.50
The payout diagram looks like this with the expiration breakeven point close to where the current price is.
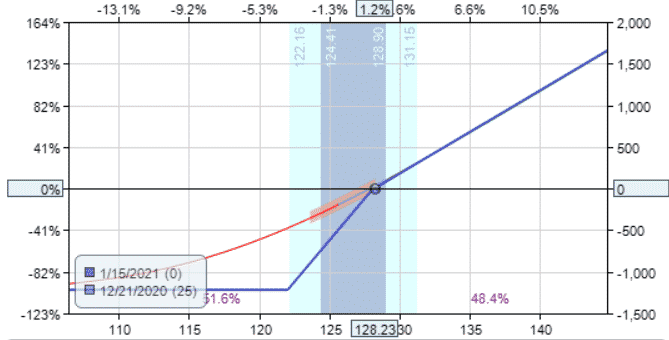
If the price goes up, the investor profits.
If the price goes down, the investor’s P&L goes negative.
Just like owning stock, there is a 50/50 chance that the price will either go up or down.
The probability of profit in with this strategy is 50-50.
ZEBRA Strategy Trade Management
Since this is a stock replacement strategy, we manage it like a stock.
The thesis for going long on AAPL is the technical pattern of a bullish candle bouncing up from the 8-day moving average, which is also above the upward sloping 20-day simple moving average.
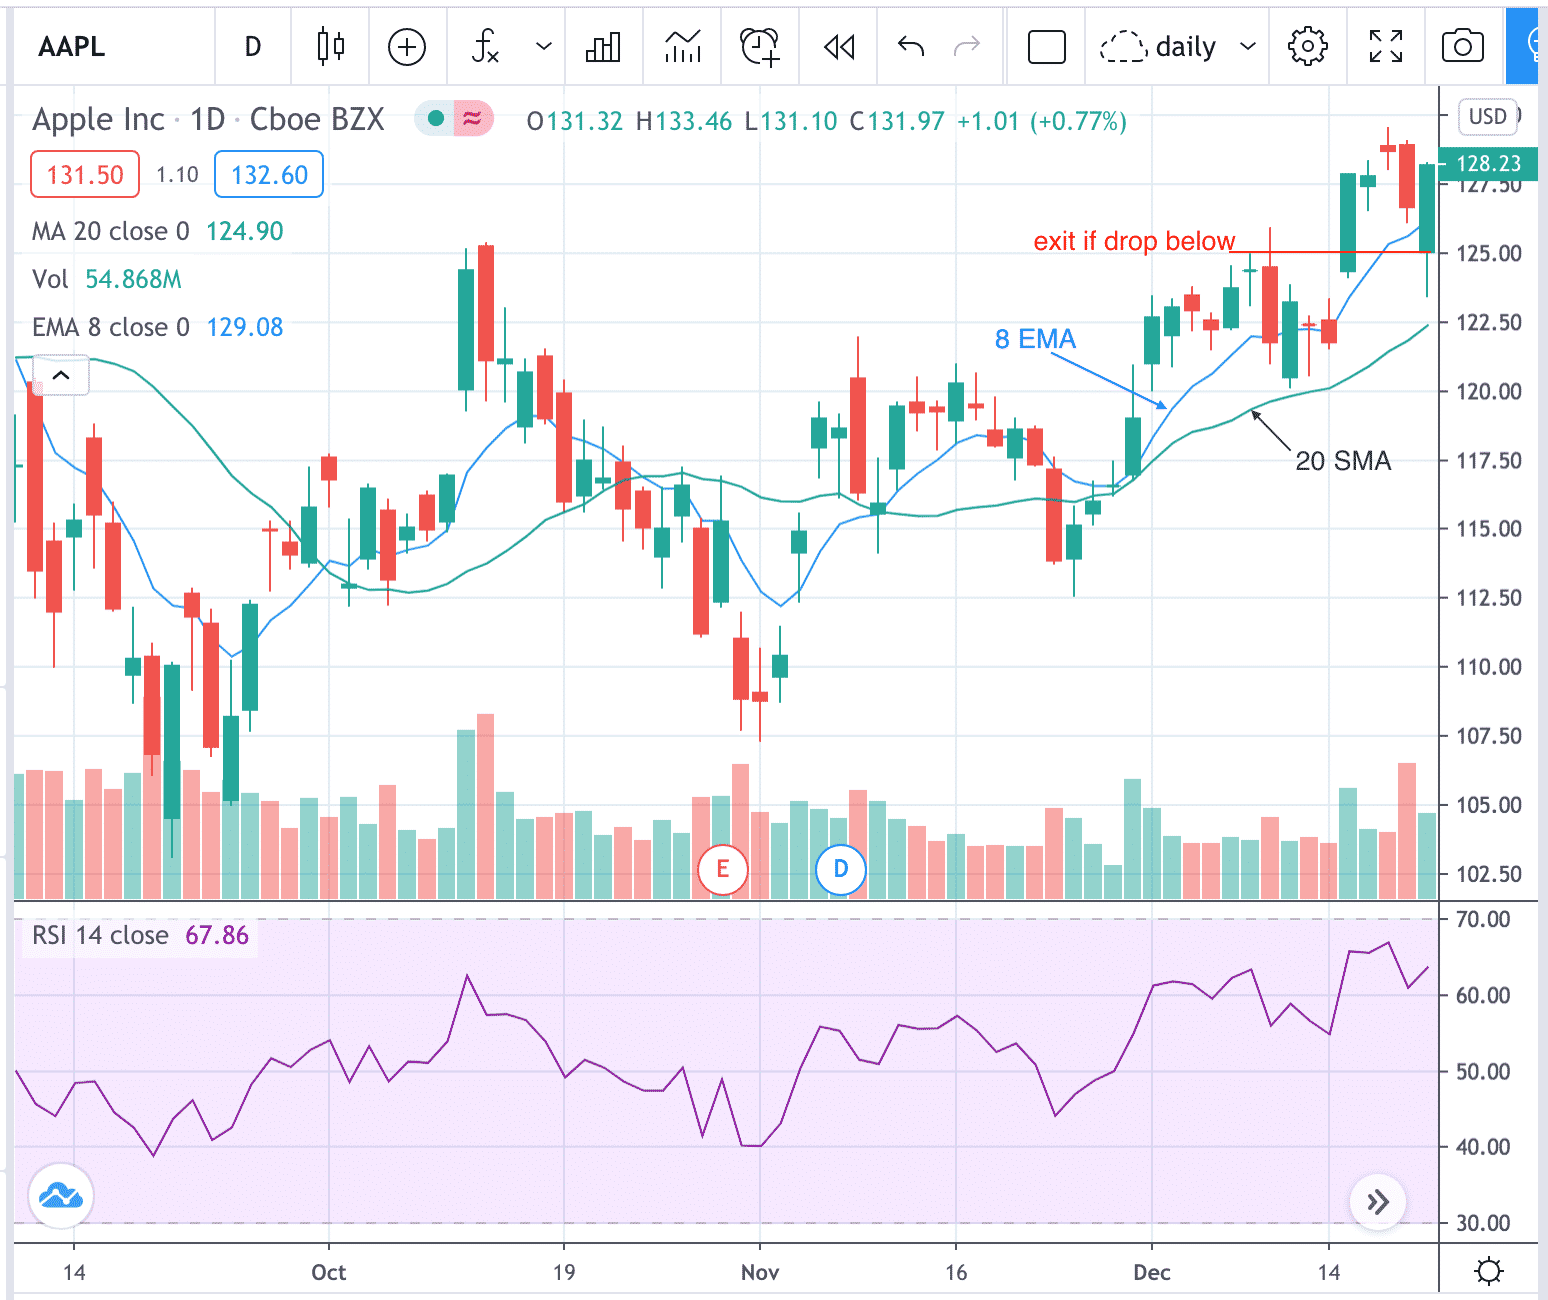
RSI is stair-stepping upward, but not in overbought territory.
There is no immediate overhead resistance.
So, there is still room for AAPL to go up.
If the technical pattern does not play out and AAPL drops below $125 which is below the 8 EMA and below the candle open, that would be a good place for a stop loss.
Looking at the payoff graph, we can lose from $250 to $500 depending on how long we’ve been in the trade and how volatility has changed when this happens.
In order to have a reward to risk ratio of around 1.5, we make a note to exit the trade with profits if our profits gets close to $500.
From the payoff graph, this should happen when AAPL price gets to $133.
Not unreasonable at all.
In fact, AAPL reached $133 at some point in the next day on December 22, 2020.
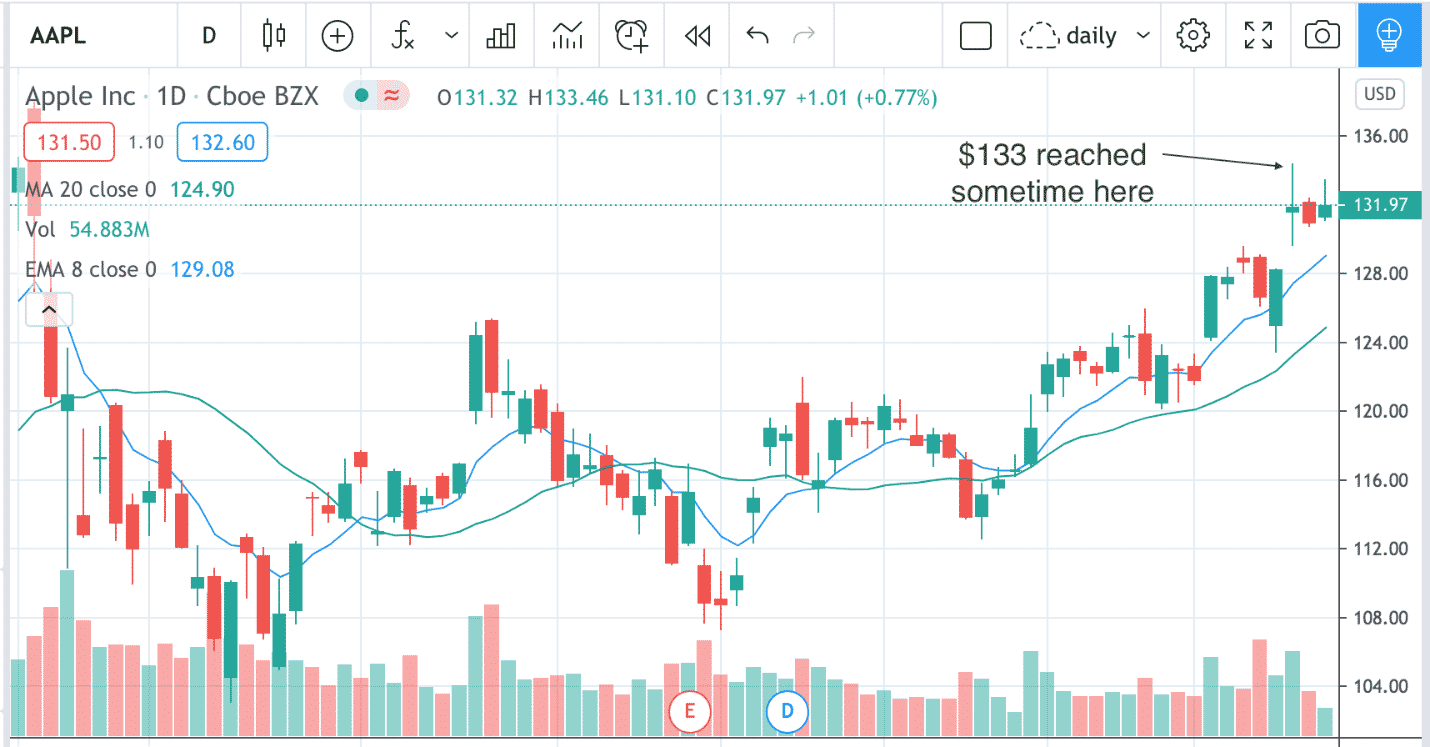
However, you are not likely to have caught that unless you were watching the screen all day.
A better way would be to have set an automatic order to exit the trade with profit at that level.
What is the Max Loss?
The ZEBRA strategy is a defined risk strategy where the max loss is the debit paid.
The max lost for the AAPL ZEBRA would be $1217.50.
A more aggressive investor willing to possibly hold till expiration might think to let the max risk be the stop loss.
We don’t recommend that, but let’s see.
For a 1.5 reward to risk ratio, the investor would need for profits to reach $1826.25 before taking profits.
For this to happen, AAPL price would need to reach price of $146.44 at expiration Jan 15, 2021.
While certainly possible, it may be a stretch.
According to the probability cone provided by OptionNetExplorer, this is about a 1.5 standard-deviation move.
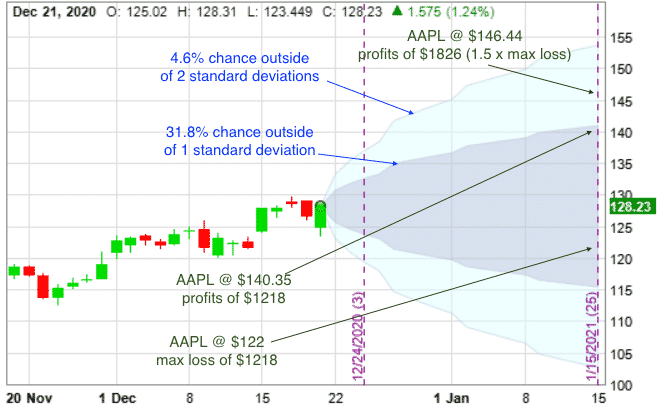
The chances of price moving more than one standard deviation is only 31.8%.
So, the chances of AAPL making a move above $146.44 is even less.
AAPL would need to be at a 52-week high to make it to $146.
Okay, let’s say we accept a lower profit target of $1218 (same as the amount of max loss).
Then AAPL price would only need to go up to $140.35, which is almost a one standard deviation move — 31.8% chance of that happening.
Poor Reward To Risk Ratio At Expiration
Wait, something is not fair with the ZEBRA payoff.
Looking at the probability cone above, in order to make profits of $1218, AAPL has to move one-standard deviation up.
But for us to lose $1218, AAPL does not have to move that far down.
Let’s see if this is fair game.
How much will we make if AAPL goes up $5?
How much will we lose if AAPL goes down $5?
AAPL current price is $128.23.
If AAPL ends up at $133.23 (five dollars up) at expiration, we make $506. If AAPL ends up at $123.23 (five dollars down) at expiration, we lose $972.
That’s not fair.
The closer you get to expiration, the more your risk to reward becomes unfavorable.
The T+0 line of the payoff graph on the upside closely follows the expiration line.
The T+0 line on the downside will morph closer to the expiration line as we near expiration.
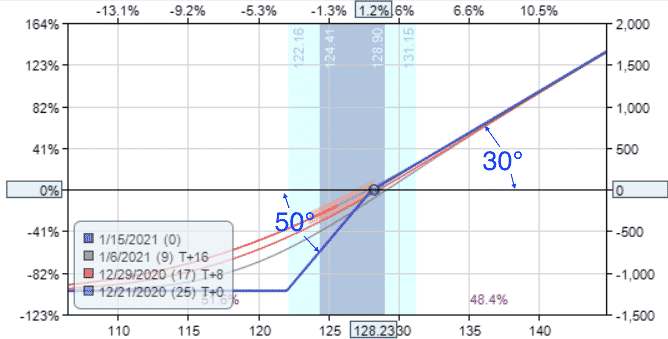
The problem is that the slope of the expiration line is steeper on the downside than on the upside — 50 degrees versus 30 degrees (you can see by putting a protractor up to your screen in the image above).
That is why we lose more than we win if the stock makes an equidistance move.
This only happens if we are close to expiration.
At the beginning of the trade, the reward to risk is much closer to one-to-one.
Hence, we don’t recommend holding this kind of trade close to expiration.
We also don’t recommend using the max loss as a stop.
$1218 is just too big of a loss.
Like the iron condor, we never want to take the max loss.
Manage, adjust or exit the trade before then.
This is not a “set-and-forget” type trade.
It requires active management.
Is The ZEBRA Like A Ratio Spread?
The ZEBRA is exactly a ratio spread.
In particular, it is a back-ratio spread.
All ZEBRAs are back-ratio spreads.
But not all back-ratio spreads are ZEBRAs.
Note that we are buying two options and selling one option.
The latter short option is our obligation.
Unlike the front-ratio spread, there are no naked short positions here. The one short option is protected by two long options.
Hence, it should be tradable in a retirement IRA account.
If your IRA account says no ratio spreads, then just put on a call debit spread first and then purchase an additional long call.
This gives you a back-ratio spread with two longs and one short option.
Can Other Ratios Be Used?
Yes, they can.
You can use three longs and two shorts.
And so on.
Just like in back-ratio spreads.
How Is This Better Than Buying A Call?
A ZEBRA is better than just buying a call because we don’t pay the extrinsic value that we normally would when buying a call.
Suppose we go long by buying calls, such as…
Buy one AAPL Jan 15, 2021 – $122 call @ $8.55 (at delta=71)
Net Debit: $855
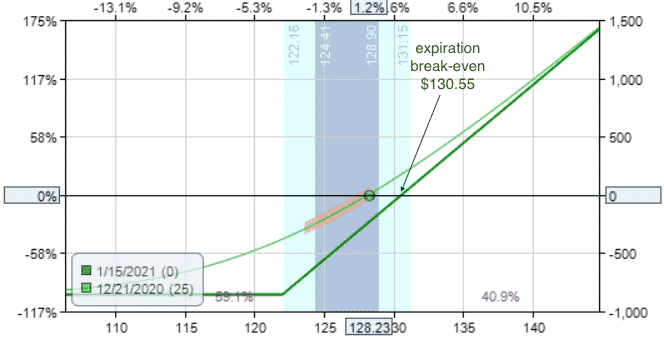
Like the ZEBRA, it caps its loss to that of the debit paid and has unlimited upside potential.
One difference is that the stock price has to move up to $130.55 at expiration just to breakeven.
In the ZEBRA, it only had to be above the breakeven price of $128.17 at expiration to profit — calculation explained later.
With calls, if the stock does not move at all, you suffer the max loss at expiration.
In the ZEBRA, if the stock does not move at all, you just about breakeven at expiration — just like a stock.
In this sense, the ZEBRA mimics a stock much better than calls.
Like the ZEBRA, the long call also has the same problem with poor reward/risk at expiration.
If AAPL ends up at $133.23 (five dollars up) at expiration, we make $268 on the call option.
If AAPL ends up at $123.23 (five dollars down) at expiration, we lose $732.
Extrinsic Value
The reason is because when you buy a call, you are paying for both intrinsic and extrinsic value.
Extrinsic value is something that you don’t want to pay if you don’t have to.
It is sometimes loosely referred to as “time premium”.
The price of the stock has to go up that much more in order to account for the extra extrinsic value that you have paid.
In the ZEBRA, we didn’t have to pay for this extrinsic value.
That’s why the breakeven was around the same place as the current stock price.
Actually, we did pay for the extrinsic value.
But in the ZEBRA, we got that money back by selling a call at a higher strike.
The extrinsic value of the two long calls we paid is offset by the extrinsic value of the call we sold.
Hence the name, Zero Extrinsic Back Ratio.
Washing Extrinsic Value
Let’s confirm.
AAPL stock was at $128.23 at the time.
The extrinsic value of the $122 call would be:
$8.55 – ($128.23 – $122) = $2.32
And since we bought two such options, we paid $4.64 in extrinsic value.
The extrinsic value of the AAPL $128 call option we sold would be:
$4.925 – ($128.23 – $128) = $4.695
This $4.695 covers the $4.64 in the extrinsic value we paid.
They almost perfectly wash each other.
More precisely, we net sold $0.055 of extrinsic value.
That is why AAPL ZEBRA’s breakeven point of $128.175 is exactly $0.055 less than its current price of $128.23.
The math works.
How Closely Does ZEBRA Replicate Stock?
Pretty close. The combined position delta of the ZEBRA is 90-delta.
100-delta would be identical to stock.
The delta of the spread is the sum of the deltas of the individual legs after reversing the sign of the short legs.
Buying two 70-delta options and selling one 50-delta option results in a 90-delta option in a calculation like this…
2 x 70 – 50 = 90
The gamma in our example is 2.52.
This low gamma means that delta does not change much as price changes.
This is especially true on the upside.
The theta is -8.10.
Like the long call, it loses a bit of value as time passes.
ZEBRA
Delta: 90
Delta Dollars: $11,541
Gamma: 2.52
Theta: -8.10
Vega: 9.56
LONG CALL
Delta: 71
Delta Dollars: $9,104
Gamma: 3
Theta: -8.66
Vega: 11.45
ZEBRA Uses Less Capital Than Stock
100 shares of AAPL would cost $12,823.
Using the ZEBRA as a stock replacement, we paid only $1217.50 — less than 10% of buying the stock.
But we have nearly the same gains as owning stock.
ZEBRA Investor:
If AAPL ends up at $133.23 (five dollars up) at expiration, we make $506.
If AAPL ends up at $123.23 (five dollars down) at expiration, we lose $972.
Stock Investor:
If AAPL ends up at $133.23 (five dollars up), we make $500.
If AAPL ends up at $123.23 (five dollars down), we lose $500.
Call Investor:
If AAPL ends up at $133.23 (five dollars up) at expiration, we make $268. If AAPL ends up at $123.23 (five dollars down) at expiration, we lose $732.
With the ZEBRA having the same win-loss ratio as stock, the main advantage of using ZEBRA as a stock replacement is the reduced capital needed and the so-called leverage it provides.
Why Not Just Buy The Stock?
For investors who have the capital available and do not want to use leverage, it is probably is simpler and more efficient to just buy the stock with an automatic stop loss to define the risk.
Stocks are more liquid with narrow bid/ask spreads and commissions are less.
However, there are certain products such as the equity indices (SPX, NDX, RUT, etc.) where they cannot be bought directly.
However, options are available.
In those cases, it makes sense to use the ZEBRA.
Another reason to use the ZEBRA is to go short in accounts that do not have permission for shorting stocks — or for investors who simply do not like shorting stock.
ZEBRA On The Downside
Let’s look at using a bearish ZEBRA on AMGN because AMGN’s short term moving averages are heading down relative to its long term averages.
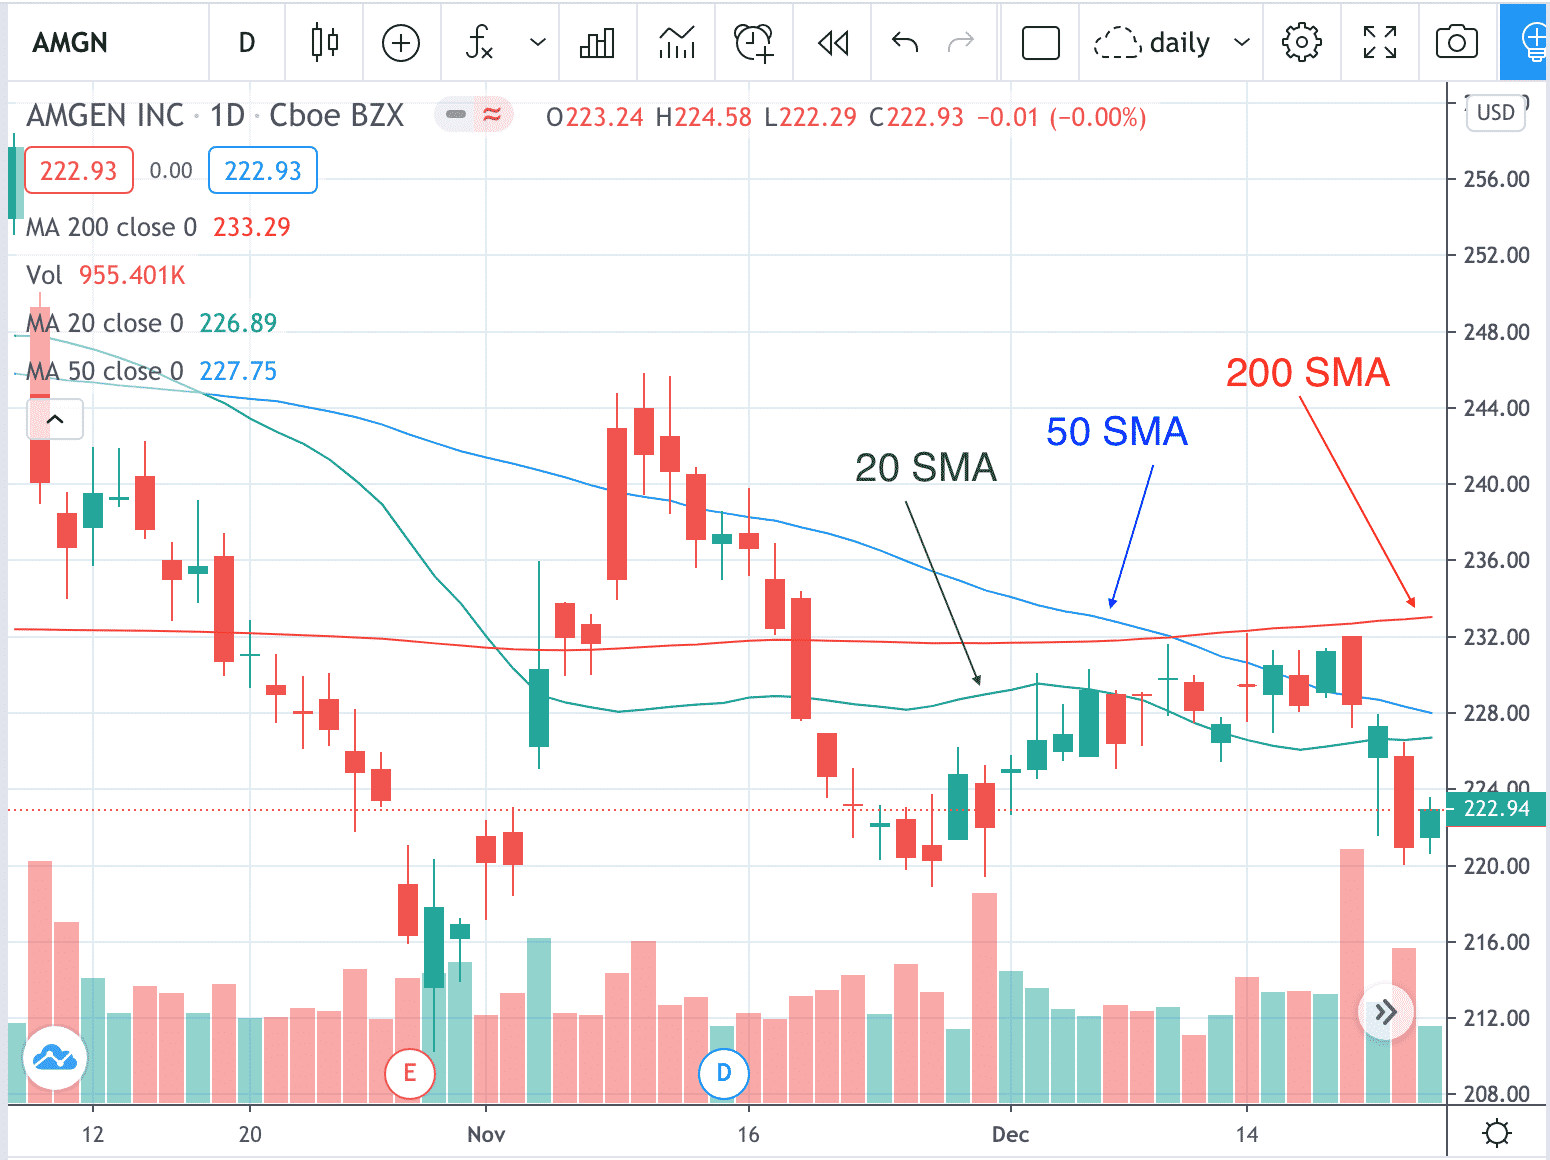
The moving averages are stacked sequentially.
The price is below the 8-day exponential moving average (not shown), which is below the 20-day simple moving average, which is below the 50 SMA, which is then below the 200 moving average.
The RSI is still not in an oversold condition.
So, there is still room for a downside move.
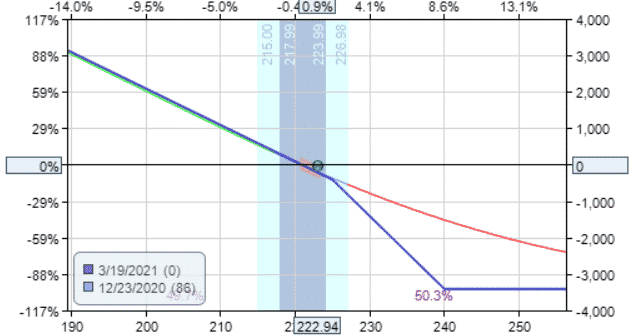
Date: Dec 23, 2020
Price: AMGN @ $222.94
Trade Details:
Sell one AMGN Mar 19, 2021 – $225 put @ $12.68 (at delta=50)
Buy two AMGN Mar 19, 2021 – $240 put @ $23.40 (at delta=69) (86 days till expiration)
Net Debit: $3413 (using 15% of the capital it takes to buy the stock)
Delta: -88
Delta Dollars: –$19,619
Gamma: 1.39
Theta: -5.19
Vega: 32.88
Days To Expiration (DTE)
The two examples are probably the extreme limits of the DTEs to use.
A 45 DTE is just about right.
You don’t want to risk putting on ZEBRA with less than 25 days to expiration, because there is going to be more negative theta (faster time decay) and larger gamma.
There is probably no need to put on ZEBRA with greater than 90 DTEs. The further out you go, the greater the exposure to volatility changes, which are difficult to predict.
The further out you go, the larger the vega and the more capital is required as well.
The P&L Calculations For Bullish ZEBRA
This would not be a comprehensive guide if we did not explain how profits and loss are calculated.
Assume we did a bullish ZEBRA where we sold one short call and bought two long calls at a lower strike.
If the price at expiration is below the long strike, we are at a max loss equal to the debit paid.
If the price at expiration is between the long strike and short strike, the P&L is calculated by:
P&L = (price at expiration – long strike price) x 200 – debit paid
If the price at expiration is above the short strike, the P&L is:
P&L = (price at expiration – long strike price) x 200 – debit paid – [(price at expiration – short strike) x 100]
Now you can verify our math in the above examples.
The P&L Calculations for Bearish ZEBRA
If price is above the long strike at expiration, the result is max loss at the amount of debit paid.
If price is between long strike and short strike at expiration:
P&L = (long strike – price at expiration) x 200 – debit paid
If price is below the short strike at expiration:
P&L = (long strike – price at expiration) x 200 – debit paid – [(short strike – price at expiration) x 100]
How is Breakeven Calculated?
The breakeven price at expiration for bullish ZEBRA will be:
Breakeven price = (2 x long strike price) – short strike price + (debit paid / 100)
As an exercise for the reader, plug in the number and confirm that the breakeven price of the AAPL example is $128.175.
The breakeven price at expiration for bearish ZEBRA will be:
breakeven price = (2 x long strike price) – short strike price – (debit paid / 100)
Conclusion
So was this guide comprehensive enough?
Was there anything that we left out?
Or maybe it was more than you even cared to know?
In any case, trade safe!
Disclaimer: The information above is for educational purposes only and should not be treated as investment advice. The strategy presented would not be suitable for investors who are ...
more

