
The Bull Is Back…But Will It Stay?

On Tuesday, the market broke out to all-time highs, but had failed to hold on to that level until a late surge on Friday. The breakout to “all-time highs” is something we have been discussing over the last several weeks both here and for our RIA PRO subscribers with Technology leading the charge.
Currently, XLK is on a “Buy” signal (bottom panel), but that signal is “crazy” extended.
However, the good news is that four sectors have broken out to all-time highs and technology is one of them. This is suggesting the overall market will break out to new highs as well.
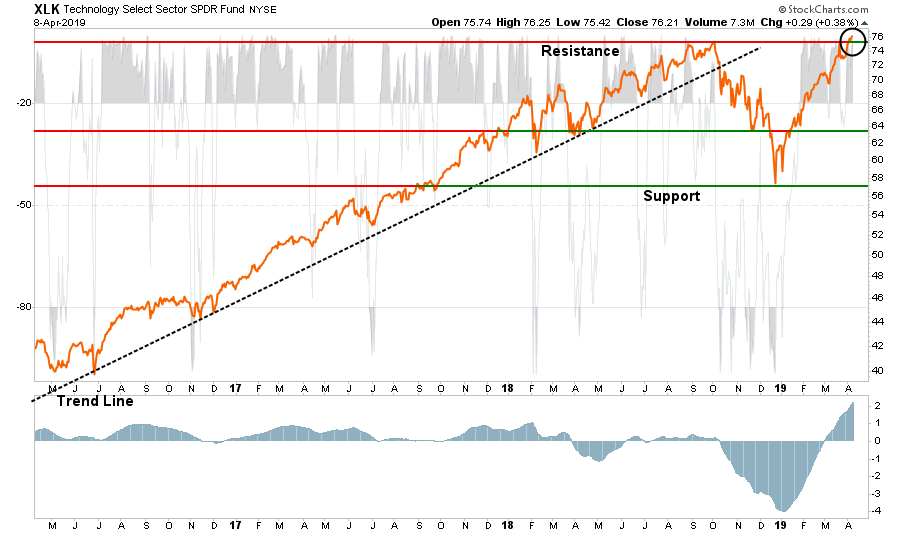
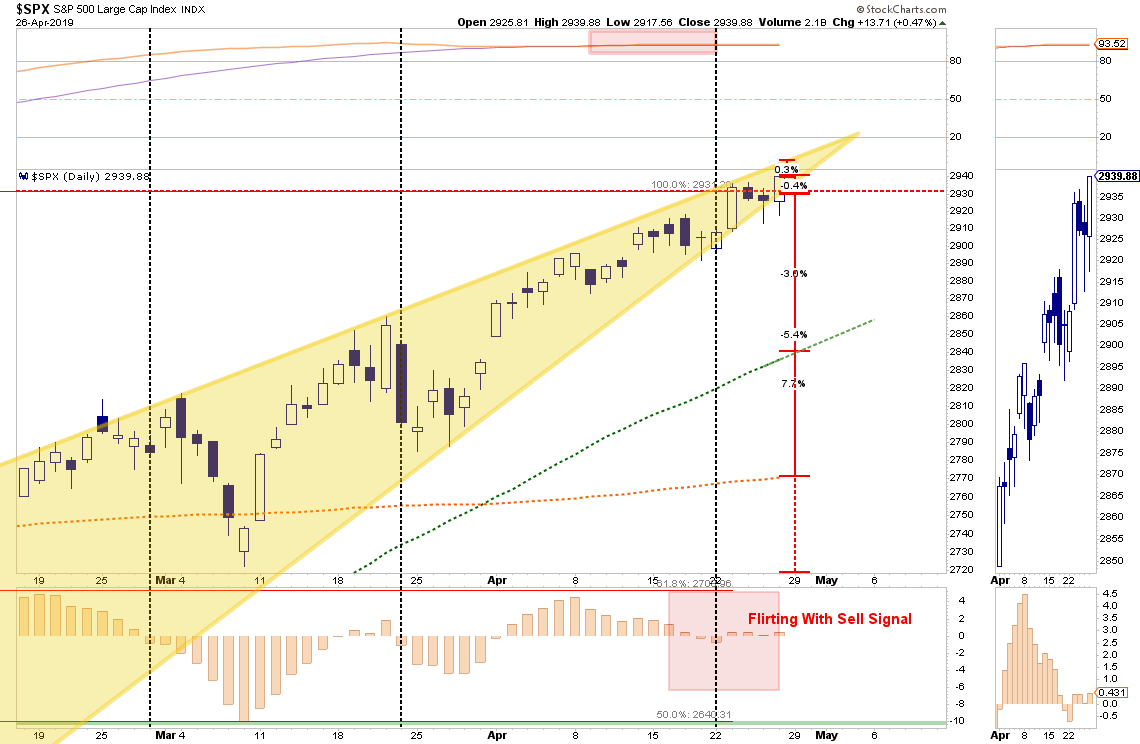
However, while that break to the upside was indeed bullish, the market remains very confined to a rising consolidation pattern and failed to close above the intraday all-time highs from last September. With the markets trading on VERY light volume on Friday, combined short-term “sell signals” forming, and pushing more extreme overbought conditions, it is too early to completely remove all risk management controls in portfolios.
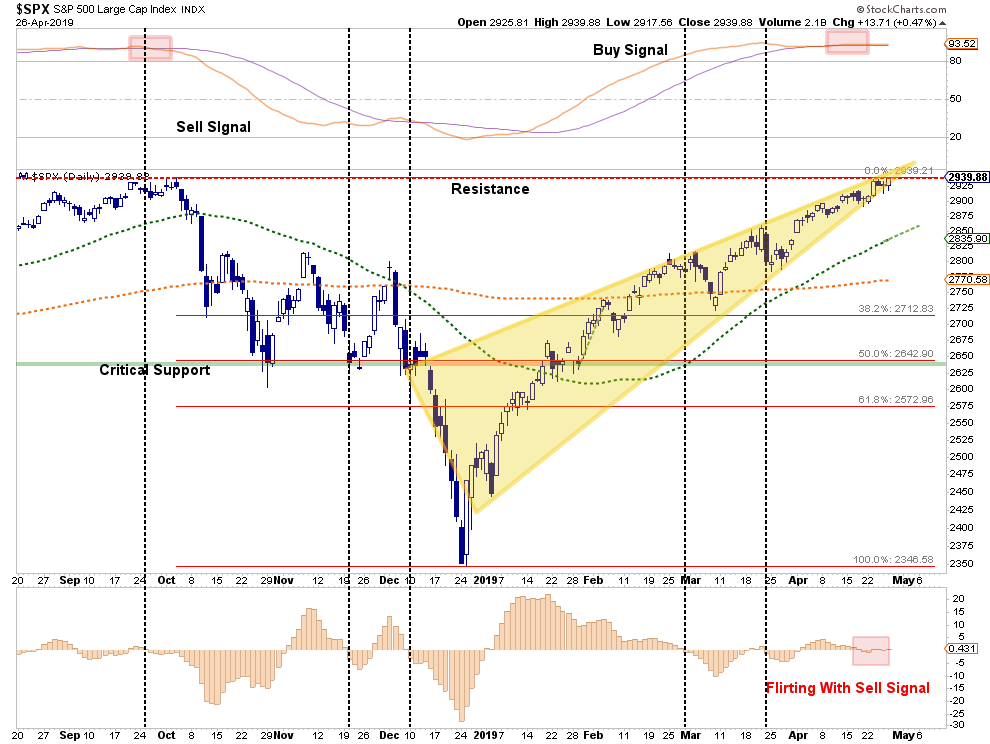
Another reason not to completely throw “caution to the wind,” is the market only requires roughly a 0.40% move in one direction or the other to break out of this very tight compression range.
The good news is a breakout, and a successful retest, to the upside will most likely lead to a continued move higher over the next month or so.
The not-so-good news is a confirmed break to the downside would result in a short-term correction ranging between a 3% decline to test the 50-day moving average, a 5.4% decline to the 200-day moving average, or a 7.7% decline back to the March lows.
While such a correction certainly falls within the realm of “ordinary” within any given year, and would provide a much better entry point for adding equity risk, clearly the risk outweighs reward at the moment and suggests higher levels of cash remains prudent.
Looking at a longer-term chart, we can see the overbought condition becomes clearer. With the market testing the underside of the running bullish trend line from 2009, a negative divergence in relative strength, and a “sell signal” in place, the historical price action under these conditions also suggests caution.
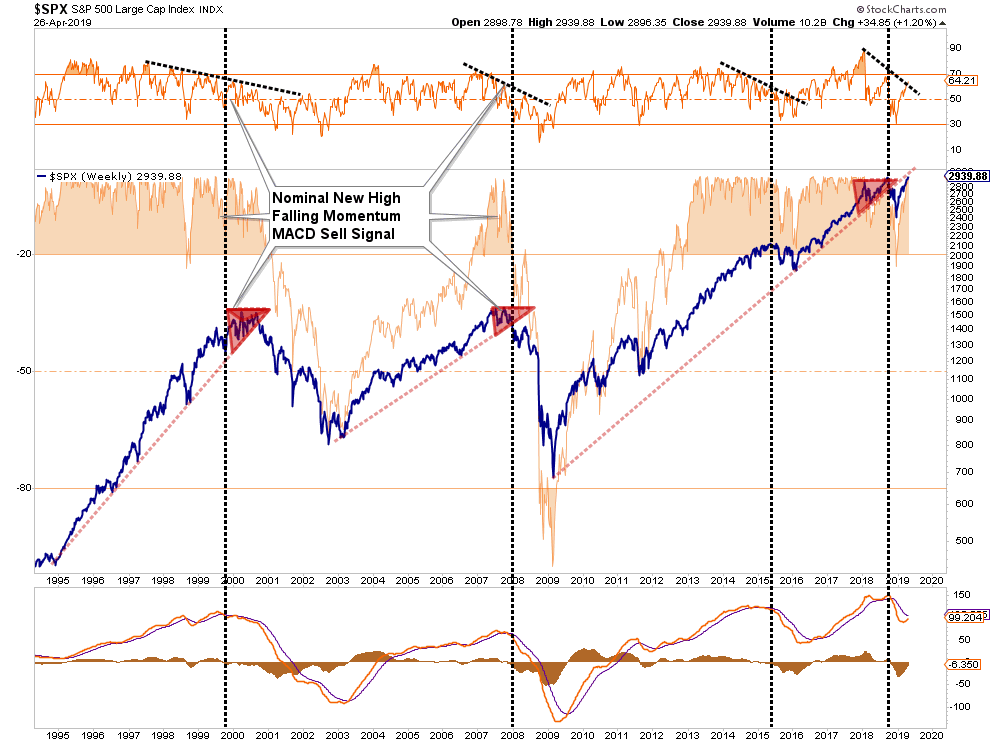
While the “bull market” is indeed back with the break out to new highs, the question is “whether it will stay.”
Bull market rallies of this magnitude and acceleration combined with diverging technicals have been met with decent corrections in every case previously.
Could this time be different? Sure, it just isn’t wise to “bet on it.”
Being patient will offer a much better entry point to add exposure to portfolios most likely sooner rather than later.
Millennial Soccer
One of the reasons given for the push to new highs, and something we had previously said was highly probable, were the “better than expected” earnings reports coming in.
“Percentage of Companies Beating EPS Estimates (78%) is Above 5-Year Average
Overall, 15% of the companies in the S&P 500 have reported earnings to date for the first quarter. Of these companies,
78% have reported actual EPS above the mean EPS estimate, 5% have reported actual EPS equal to the mean EPS
estimate, and 17% have reported actual EPS below the mean EPS estimate. The percentage of companies reporting
EPS above the mean EPS estimate is above the 1-year (76%) average and above the 5-year (72%) average.”
Wow…that’s impressive and certainly would seem to be the reason behind surging asset prices.
The problem is that “beat rate” was simply due to the consistent “lowering of the bar” as shown in the chart below:
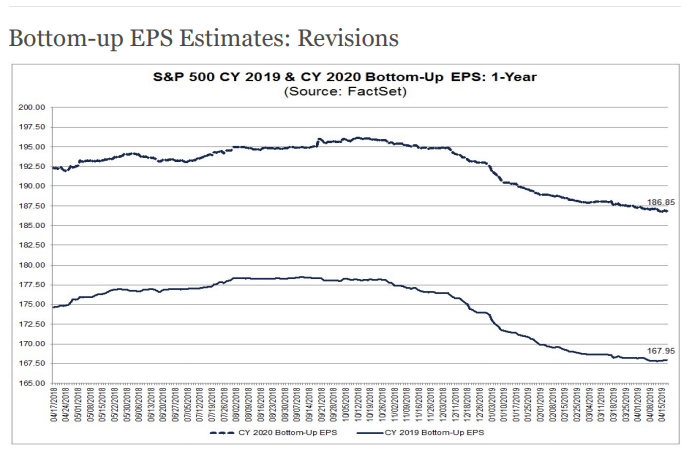
As shown, beginning in mid-October last year, estimates for both 2019 and 2020 crashed.
This is why I call it “Millennial Soccer.”
Earnings season is now a “game” where scores aren’t kept, the media cheers, and everyone gets a “participation trophy” just for showing up.
Here is the problem for unwitting investors.
- Assume you buy company XYZ at $100 based on forward earnings estimates of $10/share.(FWD PE=10)
- Not a bad bargain.
- However, before earnings season begins, analysts drop their estimates to $5/share. (PE=20)
- Not so good of a bargain.
- Company reports earnings of $5.01/share which beat earnings expectations and everyone cheers.
- Unfortunately, you way overpaid for the value received.
This is why you really have to do your homework when buying individual companies. The problem with not paying attention and basing your investment decisions on forward “operating” earnings (which is another fictitious Wall Street marketing tool to manipulate earnings) is that consistently overpaying for investments leads to lower long-term returns.
To get a clearer understanding of what is going on with the market currently, let’s take a look at the last fully reported quarter in earnings.
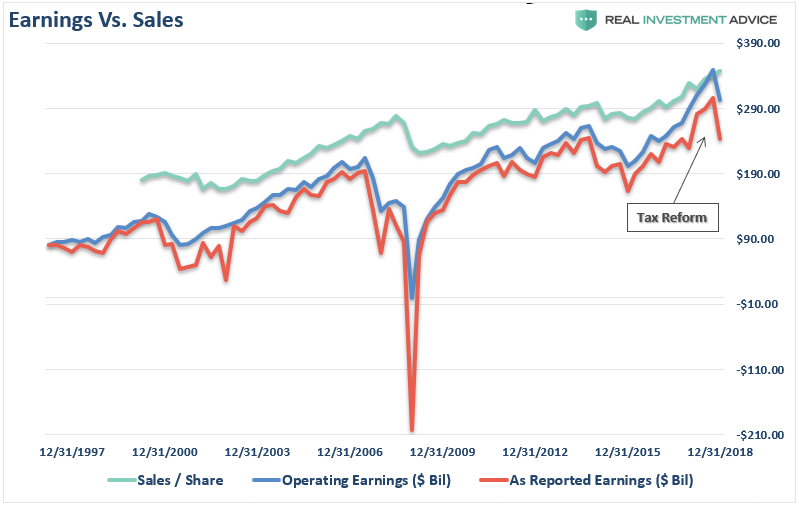
For the entire 2018 reporting year operating earnings per share rose from $124.51 per share in Q4 of 2017 to $151.60 in Q4 of 2018 for a 21.76% annual gain. Reported earnings also rose from $109.88 to $132.39 during the same period for an annualized gain of 20.49%.
That sounds pretty good.
But, before you get all excited, that surge included the benefit of the massive corporate tax reduction. However, those gains aren’t all that noteworthy when you consider that on an annualized basis 2017 operating earnings growth was 17.17% and reported earnings growth was 16.21% which was without the benefit of tax cuts.
Not nearly as exciting as the media made it out to be is it?
But the slowdown in earnings this quarter, which is expected to be a one-time anomaly before re-accelerating, is coming on the heels of a sharp slowdown in growth in the last two quarters.
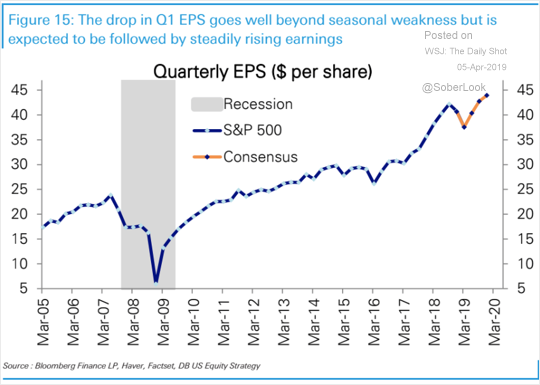
Note that while revenues have not yet turned negative, revenues tend to lag downturns in earnings. It is also worth noting that sharp downturns in earnings preceded the onset of recessions in 2001 and 2008.
More importantly, share buybacks have been doing a good chunk of the lifting for those “earnings beats.” With corporations expected to set a new record in share repurchases again in 2019, the question will become how much “bang for the buck” are they getting?
Since the recessionary lows, much of the rise in “profitability” has come from a variety of cost-cutting measures and accounting gimmicks rather than actual increases in top-line revenue. While tax cuts certainly provided the capital for a surge in buybacks, revenue growth, which is directly connected to a consumption-based economy, has remained muted.
Importantly, since 2009, the reported earnings per share of corporations has decreased from 353% in Q2-2018 to just 285% in Q4. However, even with the recent decline, this is still the sharpest post-recession rise in reported EPS in history. Moreover, the increase in earnings did not come from a commensurate increase in revenue which has only grown by a marginal 56% during the same period. (Again, note the sharp drop in EPS despite both tax cuts and massive share buybacks. This is not a good sign for 2019.)
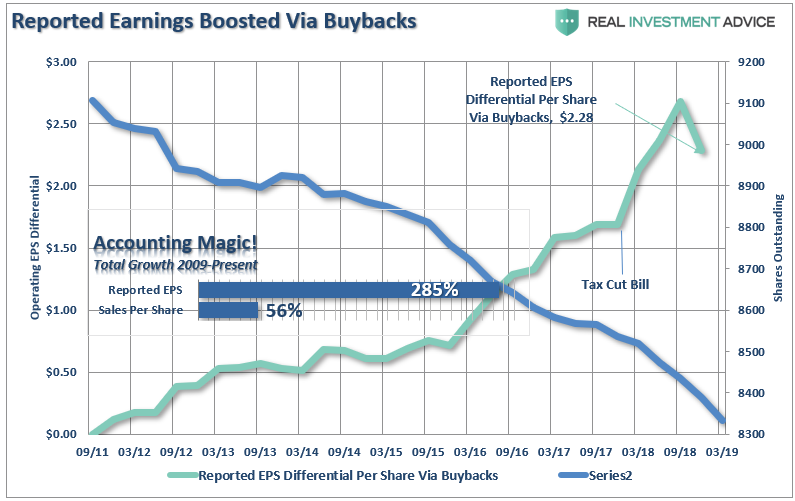
The reality is that stock buybacks create an illusion of profitability. Such activities do not spur economic growth or generate real wealth for shareholders, but it does provide the basis for with which to keep Wall Street satisfied and stock option compensated executives happy.
The next chart shows the slide in estimates just since December. Forward expectations have fallen as economic realities continue to impale overly optimistic projections. Just since February, the estimates for the front half of 2019 have plummeted.
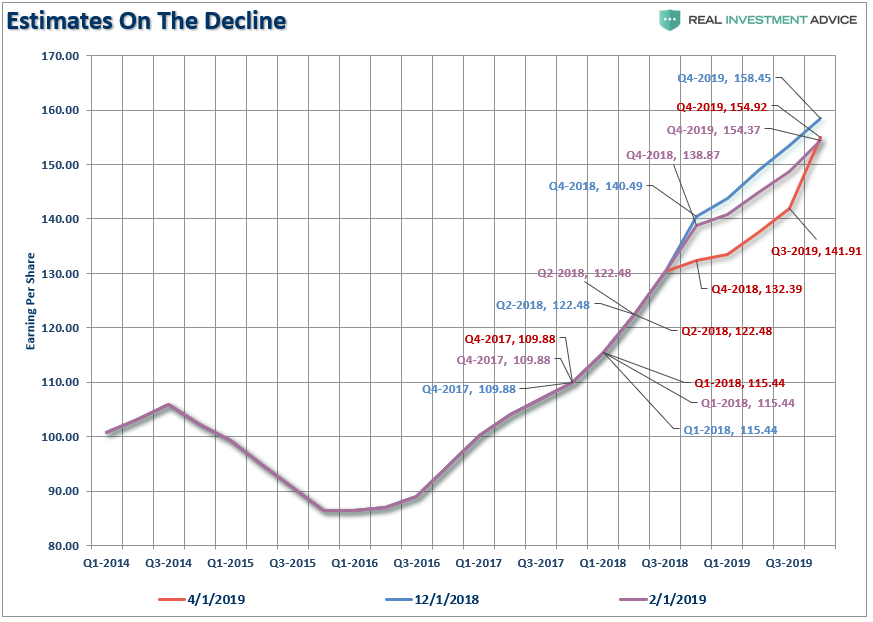
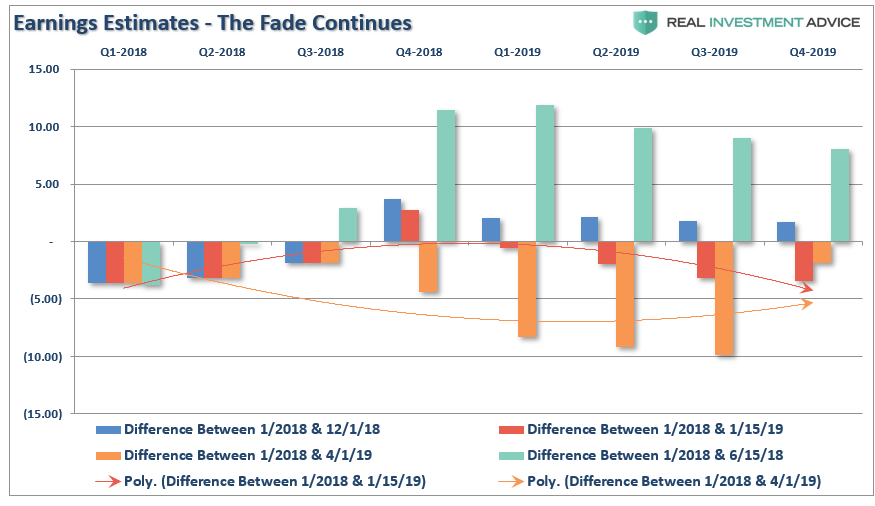
The chart below shows the changes in estimates a bit more clearly. It compares where estimates were on January 1, 2018 versus June and December of 2018 and January and April of 2019. You can see the massive downward revisions to estimates from June of last year to April of this year. As I stated above, this is why a high percentage of companies ALWAYS beat their estimates. Had analysts been required to stick with their original estimates, the beat rate would be close to zero.
This is the part where I get to say “I told you so.”
In June of 2017, I wrote “The Drums Of Trade War” stating:
“Wall Street is ignoring the impact of tariffs on the companies which comprise the stock market. Between May 1st and June 1st of this year, the estimated reported earnings for the S&P 500 have already started to be revised lower (so we can play the ‘beat the estimate game’).For the end of 2019, forward reported estimates have declined by roughly $6.00 per share.”
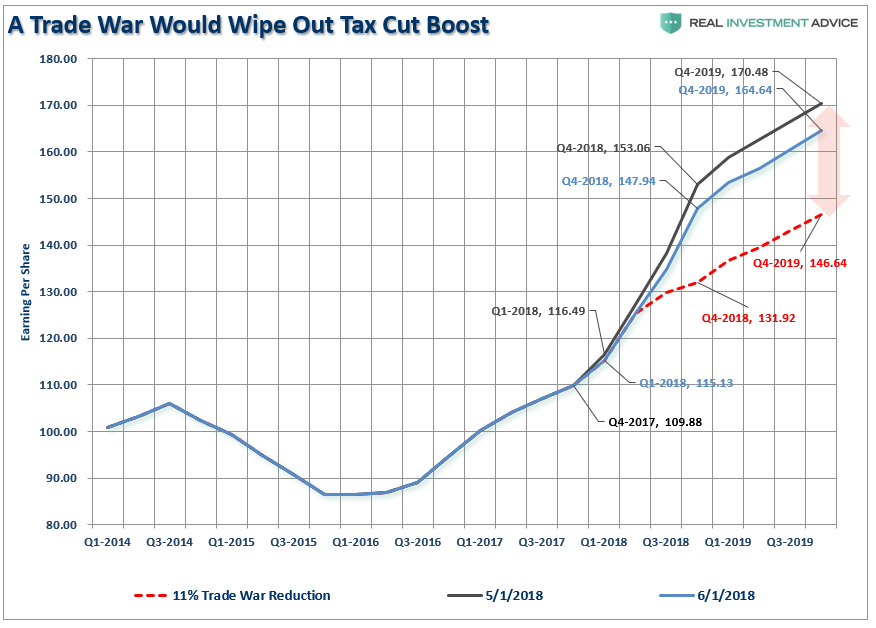
However, the red dashed line denotes an 11% reduction to those estimates due to a ‘trade war’ where an across-the-board tariff of 10% on all US imports and exports would lower 2018 EPS for S&P 500 companies and, thus, completely offset the positive fiscal stimulus from tax reform.”
Surprise! As of the end of the Q4-2018 reporting period, guess where we are? Exactly 11% lower than where we started which, as stated then, has effectively wiped out all the benefit from the tax cuts.
Sadly, as we noted several times in early 2018, the entire piece of legislation to cut corporate taxes was squandered with “Trump’s trade war” which has yet to yield any tangible positive benefits economically speaking.
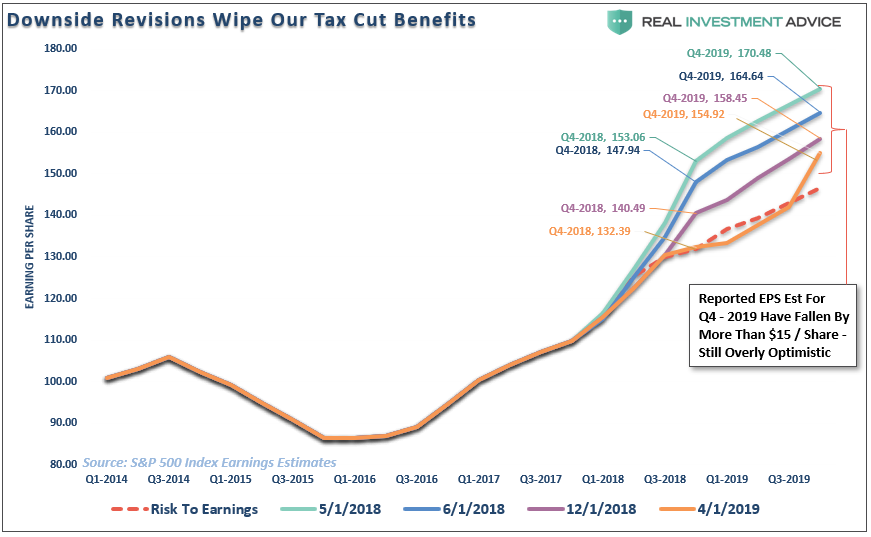
Importantly, the estimates for the end of 2019 are still too high and will need to revised lower over the next couple of quarters as economic growth remains materially weaker. The burgeoning debts and deficits, corporate and household leverage, and slower job growth will ensure slower growth into year end.
But since we are playing “Millennial Soccer,” let’s look at data which is devoid of a lot of the manipulation. Corporate profits, rather than earnings, is what is reported to the Internal Revenue Service for taxation purposes. It strips out the accounting gimmicks found in operating earnings, share buybacks, and other obscuring factors.
While stock prices have surged to all-time highs, corporate profits remain at the same level as they were in 2011 on a pre-tax basis, and 2014 on a post-tax basis despite the massive drop in tax rates.
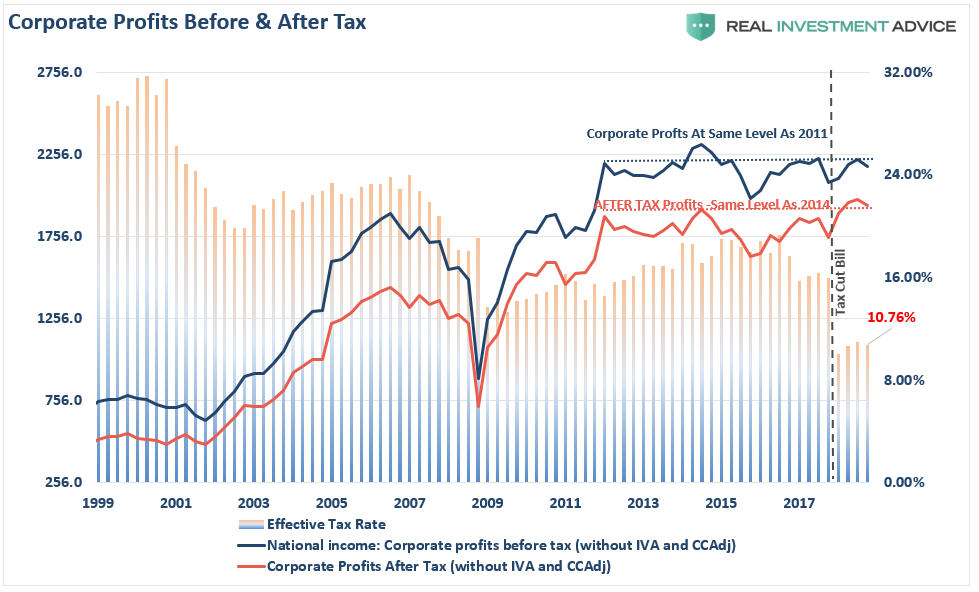
As I noted Thursday:
“While the WSJ is correct that corporate profits now 10% of GDP, up from 6-8% prior to the turn of the century, there are two factors worth noting.
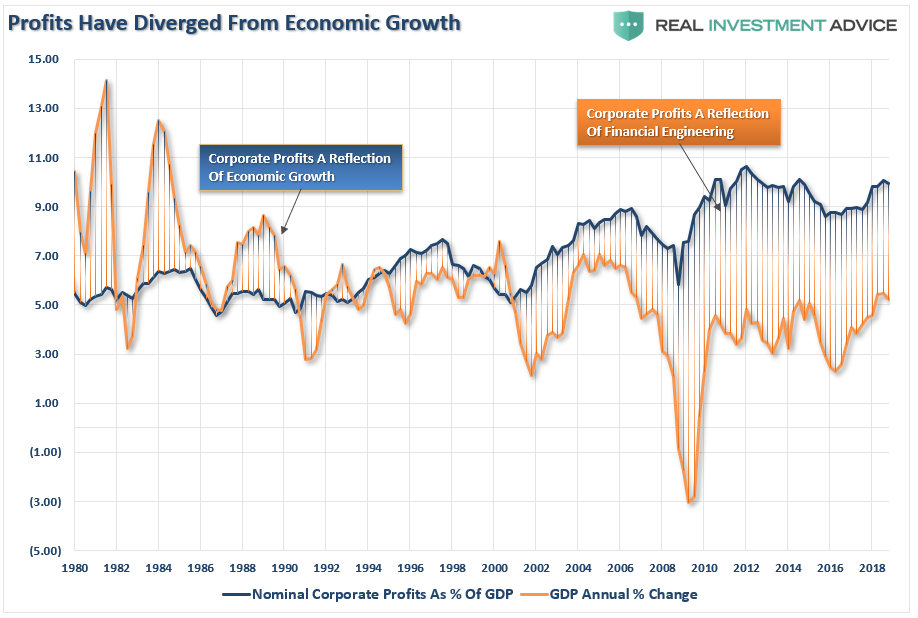
- Corporate profits are very diverged from economic growth which is contributing to the wealth inequality issue.
- The profit/GDP ratio is still lower than it was in 2010-2011 despite the massive boost from tax cuts, $1 trillion in deficit spending, and a booming stock market.”
Quick note on Q1-GDP report:
On Friday, the first estimate of Q1 GDP report was much stronger than expected coming in at 3.2% versus estimates of 2.3%. There are a couple of important takeaways from the report:
- The first estimate is simply a collection of economists estimates as most of the data for the first quarter has not been fully compiled yet. This suggests the next two estimates will likely be revised lower due to some of the recent softness in data we have seen.
- Almost 50% of the increase in GDP came from slower imports and a massive surge in inventories which suggests slower consumer consumption which comprises roughly 70% of economic growth. (In other words, future GDP reports will also likely be weaker. (Net Trade and Inventories was 1.68% of the 3.2% rise.)
- Had CPI been used rather than the BEA’s more questionable measure of “inflation,” GDP in the first quarter would have been just 1.56% which is more aligned with the actual activity seen in the first quarter.
- This puts the Federal Reserve in a very tough position of NOT raising rates further and eliminates any possibility of a reduction in the Fed’s balance sheet.
- Lastly, bonds yields should have surged on this number suggesting a much strong economic growth rate. However, yields fell on Friday signaling that investors are continuing to question both economic growth and the market rally.
“But…the global slowdown is temporary.”
The expectation of an economic recovery to support the continuation of the bull market is likely misplaced for several reasons.
- The Fed rate hikes that were done in 2018 are still working their way through the economy, Higher rates are impacting economically sensitive sectors like autos, housing, and manufacturing.
- Economic growth globally remains weak and is impacting growth in the U.S.
- Interest rates, and the yield curve, despite stocks hitting “all-time” highs are suggesting that economic weakness is likely more pervasive than currently believed.
- The rising trend of the U.S. dollar will impact exports which makes up between 40-50% corporate profits.
- Imports continue to suggest the U.S. consumer, 70% of the economy, is weaker than headlines suggest.
- Rising oil prices, and gasoline prices, are a tax on consumers and will further impair economic growth.
- Deflation is a rising concern.
- There is no massive slate of natural disasters to pull forward consumption or boost manufacturing, construction or commodity demand.
- While deficit spending is certainly supportive of growth, with the deficit already at $1.2 trillion, the rate of change in deficit spending will not be supportive of stronger economic growth.
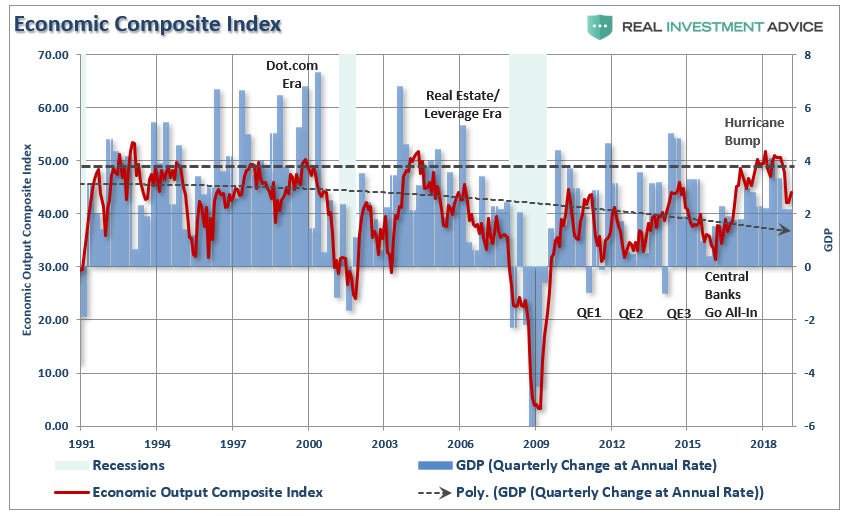
The RIA economic composite index (a broad composite of hard, soft, and leading indicators and surveys) has turned lower. Historically, turns from high levels (dashed black line) tend to revert to the lower bound suggesting more economic weakness is likely in the quarters ahead.
Oh…you are just being bearish.
Maybe, but as I stated in Q2 of 2018:
“The deterioration in earnings is something worth watching closely. While earnings have improved in the recent quarter, due to the benefit of tax cuts, it is likely transient given the late stage of the current economic cycle, continued strength in the dollar and potentially weaker commodity prices in the future. Wall Street is notorious for missing the major turning of the markets and leaving investors scrambling for the exits.
Of course, no one on Wall Street told you to be wary of the markets in 2018. While we did, it largely fell on deaf ears.
Currently, there is “no perceived risk” in the markets as represented by the second highest levels of VIX shorts on record.
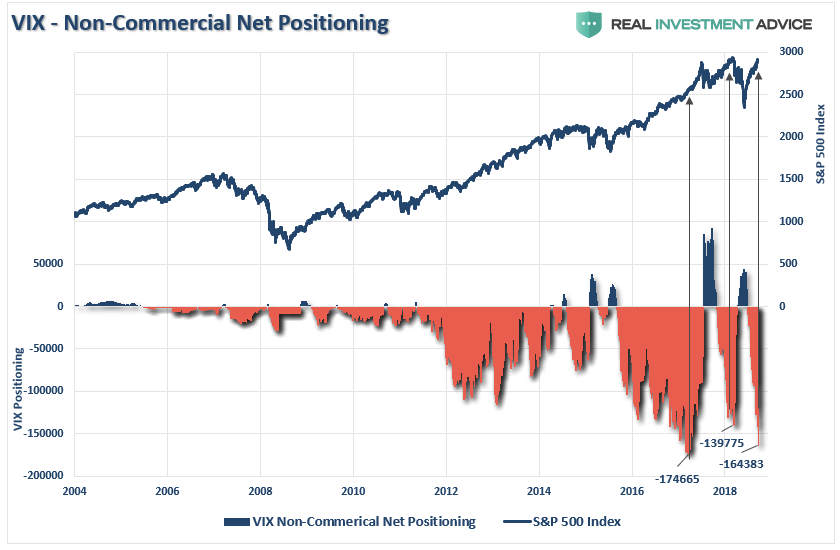
However, “risk” is like grabbing the tail of a rattlesnake. Nothing happens at first, but it can whip around and bite you faster than you can imagine.
Market & Sector Analysis
Data Analysis Of The Market & Sectors For Traders
THE REAL 401k PLAN MANAGER
A Conservative Strategy For Long-Term Investors
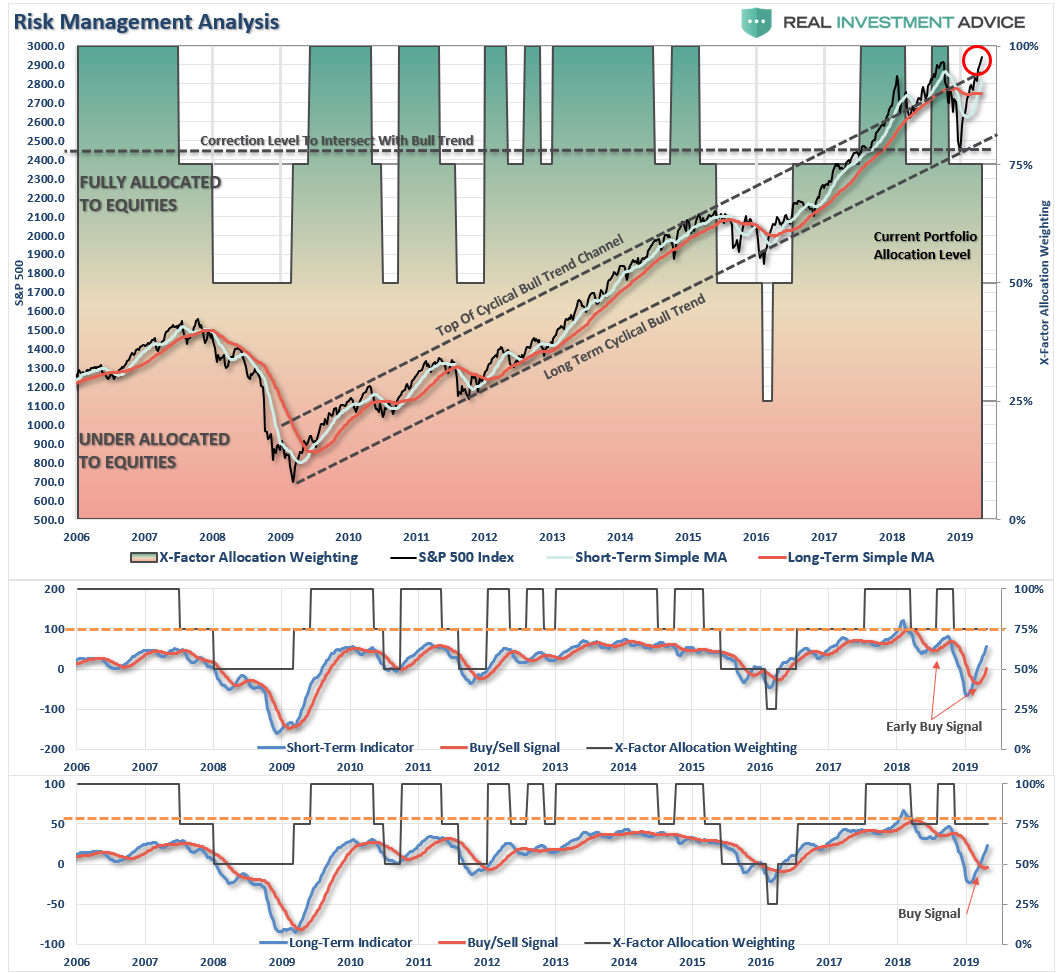
There are 4-steps to allocation changes based on 25% reduction increments. As noted in the chart above a 100% allocation level is equal to 60% stocks. I never advocate being 100% out of the market as it is far too difficult to reverse course when the market changes from a negative to a positive trend. Emotions keep us from taking the correct action.

New Highs
The market struggled most of the week, but did finally breakout to new highs this past week. However, that breakout comes on light volume, extremely overbought and extended markets, and close to triggering very short-term sell signals.
As is always the case, by the time these more “bullish” actions occur, the risk/reward opportunity in the short-term is not generally favorable. In this case, in particular, the angle of ascent of the markets from the December lows has been more abnormal than not.
I understand. The general feeling right now is one bordering on near panic as it “seems” this market simply won’t ever correct again.
Don’t fall into that trap. Your opportunity is coming soon.
With both “buy” signals now in place we WILL move target allocations move to 100% equity exposure on any corrective actions which reduces the extreme overbought short-term condition without violating important support.
In the meantime, we can prepare for this opportunity by continuing our actions we have recommended over the last several weeks.
- If you are overweight equities – take some profits and reduce portfolio risk on the equity side of the allocation. However, hold the bulk of your positions for now and let them run with the market.
- If you are underweight equities or at target – remain where you are until the market gives us a better opportunity to increase exposure to target levels.
Current 401-k Allocation Model
The 401k plan allocation plan below follows the K.I.S.S. principle. By keeping the allocation extremely simplified it allows for better control of the allocation and a closer tracking to the benchmark objective over time. (If you want to make it more complicated you can, however, statistics show that simply adding more funds does not increase performance to any great degree.)
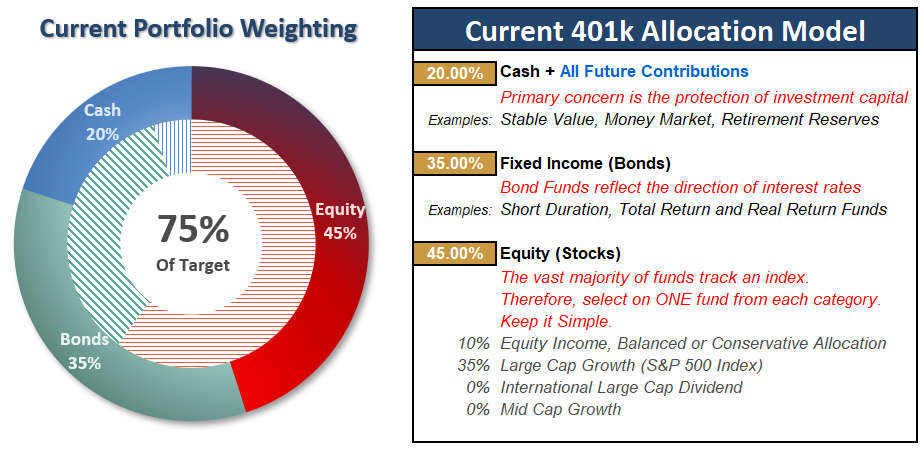
401k Choice Matching List
The list below shows sample 401k plan funds for each major category. In reality, the majority of funds all track their indices fairly closely. Therefore, if you don’t see your exact fund listed, look for a fund that is similar in nature.

Get A 30-Day Free Trial Now of RIA PRO.


Really good article.