
The 3 Most Notable Features Of Q2 Earnings Season
Image: Bigstock
Regular readers of our earnings discussions know that we have been very impressed with the all-around strength and momentum of the Q2 earnings season. That said, the three features we dive into here really stand out to us as we move into the final phase of this reporting cycle.
On the reporting docket this week (week of August 9th), we will have results from more than 650 companies, including 13 S&P 500 members. The more prominent companies reporting results this week include Disney (DIS - Free Report), eBay (EBAY - Free Report), Tyson Foods (TSN - Free Report), and others. By the end of this week, we will have seen Q2 results from 457 S&P 500 members or 91.4% of the index’s total membership.
The first notable feature of the Q2 earnings season is the impressive momentum on the revenue side, both in terms of growth rate as well as the beats percentages.
For the 444 S&P 500 companies that had reported Q2 results through Friday, August 6th, earnings and revenues were up +105.1% and +27.4%, respectively. The proportion of these companies beating consensus EPS and revenue estimates came in at 87.4% and 86.9%, respectively. The proportion of these 444 companies beating both EPS and revenue estimates, the so-called ‘blended’ beats percentage, is at 80%.
These are impressive numbers any way you look at them, but the momentum on the revenue side is particularly notable. The comparison charts below compare the revenue growth rate and blended beats percentage for the 444 index members that have reported Q2 results already with what we had seen from that same group of companies in other recent periods.
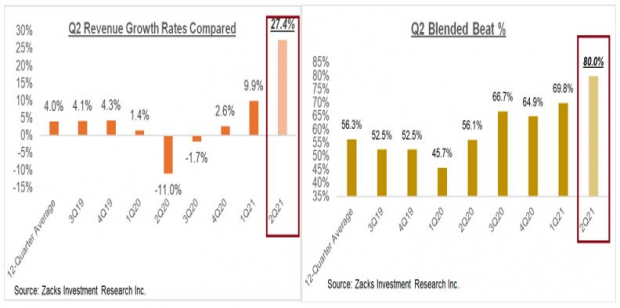
Image Source: Zacks Investment Research
The second notable feature of the Q2 earnings season is the magnitude of corporate profitability. The Q2 earnings growth rate has undoubtedly benefited from easy comparisons to the year-earlier period which was hit hard by the pandemic-related lockdowns. But it isn’t only easy comparisons, corporate profitability really is very high even though a number of sectors still have some ways to go before getting back to pre-Covid profitability levels.
As you can see in the chart below, Q2 earnings are on track to reach a new all-time quarterly record, surpassing the record set last quarter (Q1 FY21).
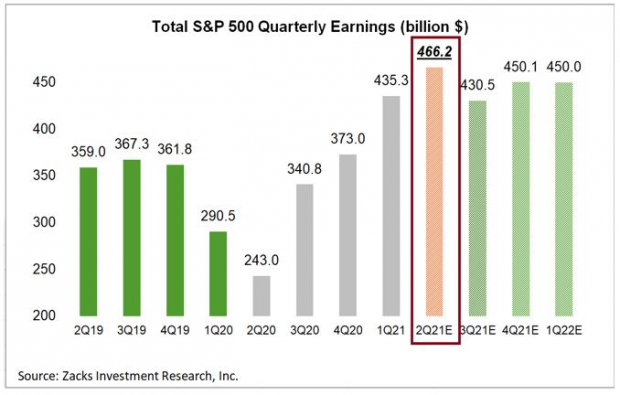
Image Source: Zacks Investment Research
The third notable feature of the Q2 earnings season pertains to the revisions trend for third-quarter earnings estimates. Total S&P 500 earnings in Q3 are expected to be up +26.3% on +13.2% higher revenues. The chart below shows Q3 estimates have evolved since the start of the year.
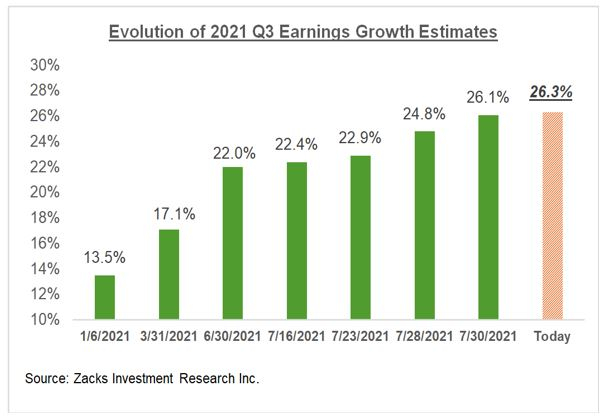
Image Source: Zacks Investment Research
Please note the while the revisions trend remains positive, in line with the trend we have been seeing since last Summer, the magnitude of upward revisions is on the lower side relative to what we had seen in the preceding quarter’s comparable period. Perhaps it is nothing more than some cautiousness in the face of the Delta variant but is something we will be closely monitoring.
What is Expected for Q2 & Beyond?
Looking at Q2 on a blended basis, combining the results that have come out with estimates for the still-to-come companies, total earnings for the S&P 500 index are currently expected to be up +91.8% from the same period last year on +24.2% higher revenues, with the growth rate steadily going up as companies come out with better-than-expected results. This would follow the +49.9% earnings growth on +10.3% higher revenues in 2021 Q1.
A big part of the unusually strong earnings growth expected in the Q2 earnings season is due to easy comparisons to last year’s Covid-hit period. But as we have been consistently pointing out, not all of the growth is a result of easy comparisons. In fact, Q2 earnings are on track to be up +29.9% from the pre-Covid 2019 Q2 period and are on track to reach a new all-time quarterly record.
The chart below takes a big-picture view of the quarterly earnings and revenue growth pace.
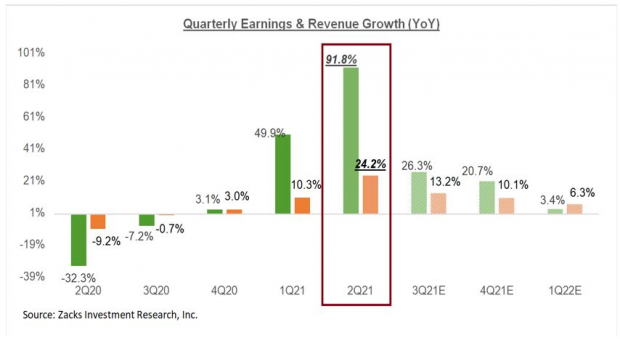
Image Source: Zacks Investment Research
The chart below presents the big-picture view on an annual basis. As you can see below, 2021 earnings and revenues are expected to be up +40.6% and +11.6%, respectively, which follows the Covid-driven decline of -13.1% in 2020.
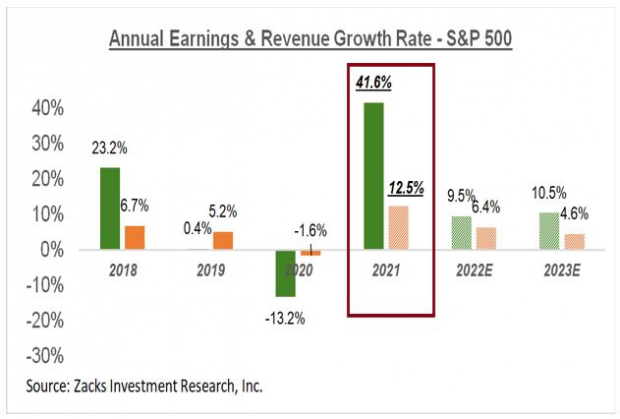
Image Source: Zacks Investment Research
Please note the strong earnings growth expected in each of the next two years. This suggests that the market isn’t looking for a one-off rebound this year, but rather an enduring growth cycle that continues over the next couple of years.
To the extent that this growth outlook can improve as we move into the back half of 2021 will determine whether the overall earnings picture is getting better or leveling off.
Disclosure: Zacks.com contains statements and statistics that have been obtained from sources believed to be reliable but are not guaranteed as to accuracy or completeness. References to any specific ...
more


One concern that have is that it appears that in all instances growth and profits are calculated compared to the "glitch" that produced an extreme in the opposite direction, instead of being compared to the running average prior to that. The result is an incorrect impression, apparently very intentional, and certainly rather misleading.