
Technically Speaking: A Decision Point Is Coming… Soon
As discussed previously, I added a small trading position of equal weight S&P 500 to the core portfolio strategy in portfolios. To wit:
“However, as stated above, I did add a small trading position to the portfolios of an equal weight S&P 500 index ETF (SPY). I am maintaining a very tight stop at the current running bullish trend line, as shown below. I am not highly confident in the addition of the position at the current time, but the market has continued to consistently hold the bullish trend line.Again, this is a trading position and NOT a long-term hold at this point.”

I have not yet been stopped out of that position and are currently holding a very small gain.
Yesterday, I added a small position in Gold (GLD) to portfolios as well. This is a commodity/dollar trade with a decent risk/reward setup. It is not a commentary on the coming collapse of the economy as we know it. Well, at least not yet, that may come later.
The chart below shows the inverse correlation between the U.S. Dollar and Gold. I wrote several weeks ago the dollar would be getting stronger as it was in an uptrend as higher rates in the U.S. attracted foreign flows in the dollar. This is a longer term view that will continue to develop, but as shown in the chart below the dollar is currently very overbought with gold correspondingly very oversold.
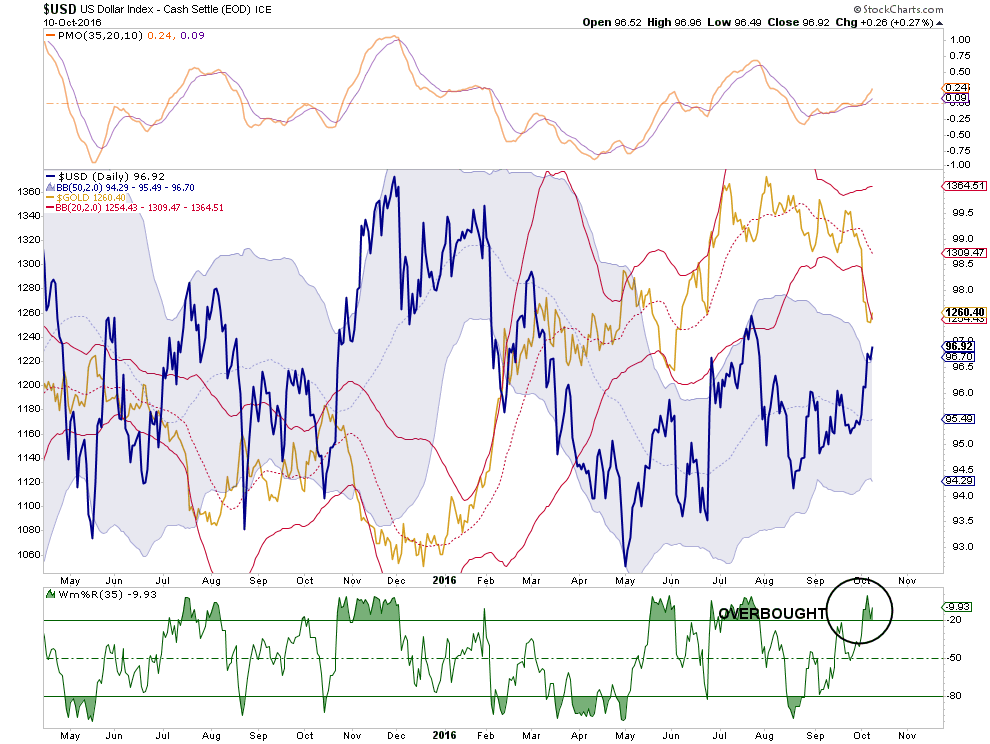
As shown, with the dollar now two standard deviations above its 50-dma, and gold more than two standard deviations below, a trade in gold now seems reasonable. With a stop currently at $1240 an ounce and a target of $1320, a 3:1 reward/risk ratio is acceptable.
This is also an important point. Whenever a position is added to a portfolio it should NEVER be initially viewed as a long-term hold. As with gold, every position should have a stop loss and a target sell price BEFORE the position is purchased. If a trading position grows into a long-term hold due to performance, then all the better. However, too many losing positions, which should have been cut short, become long-term holds in the “hope” they will come back. If you aren’t careful, a portfolio can become predominately stocks you are hoping will come back rather than growing your portfolio towards your investment goals.
Market Decision Nears
In this past weekend’s missive I noted:
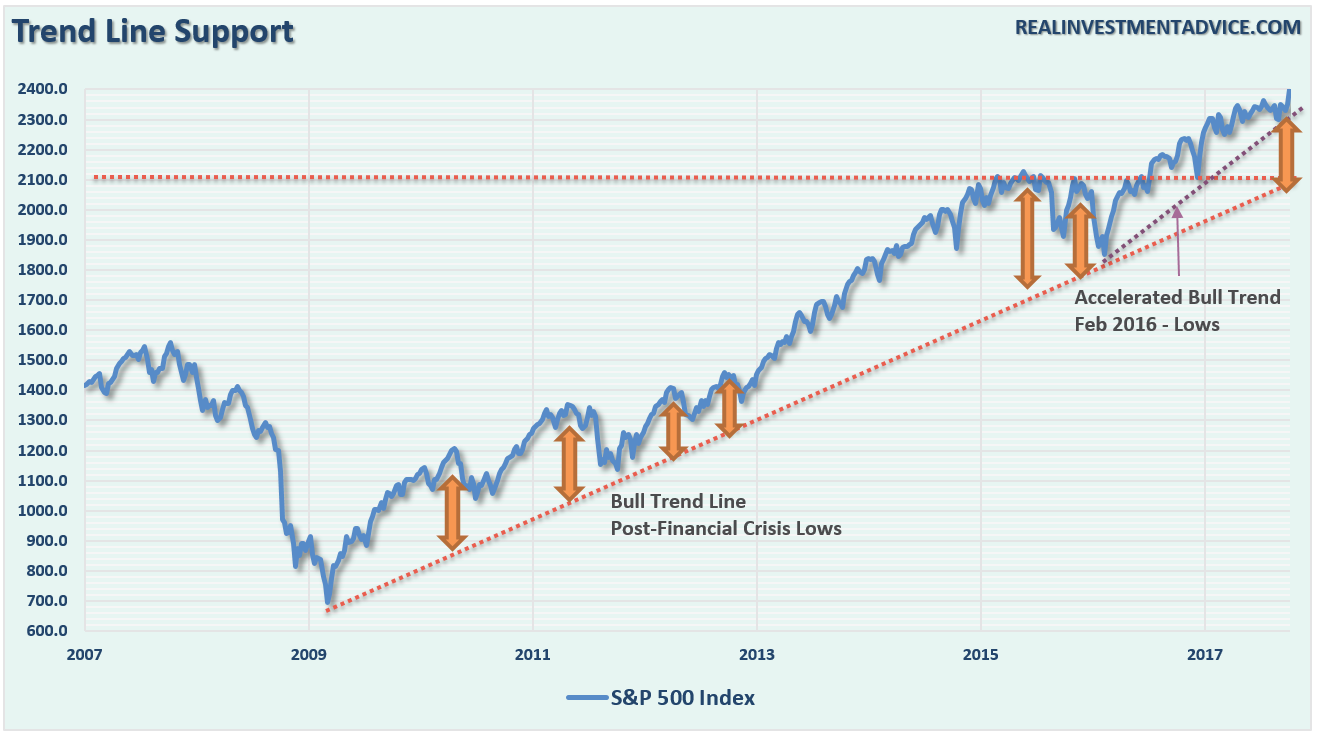
“The market currently remains above the running bullish trend line which has been the rally point for Central Banks to intervene with either actual monetary interventions or promises to do more. Despite concerns of global disruption due to the ‘Brexit,’ or the next potential bank failure with Deutsche Bank, nothing has been able to shake the markets as investor complacency remains elevated.
As shown below, the current price action continues to consolidate in a very tight range which will resolve itself in very short order. A breakout to the upside will clear the markets for a further advance. However, while the technicals suggest a move to 2400, it is quite possible it could be much less. Notice in the bottom section of the chart below.Turning the current ‘sell signal’ back into a ‘buy signal’ at such a high level does not give the markets a tremendous amount of runway.”
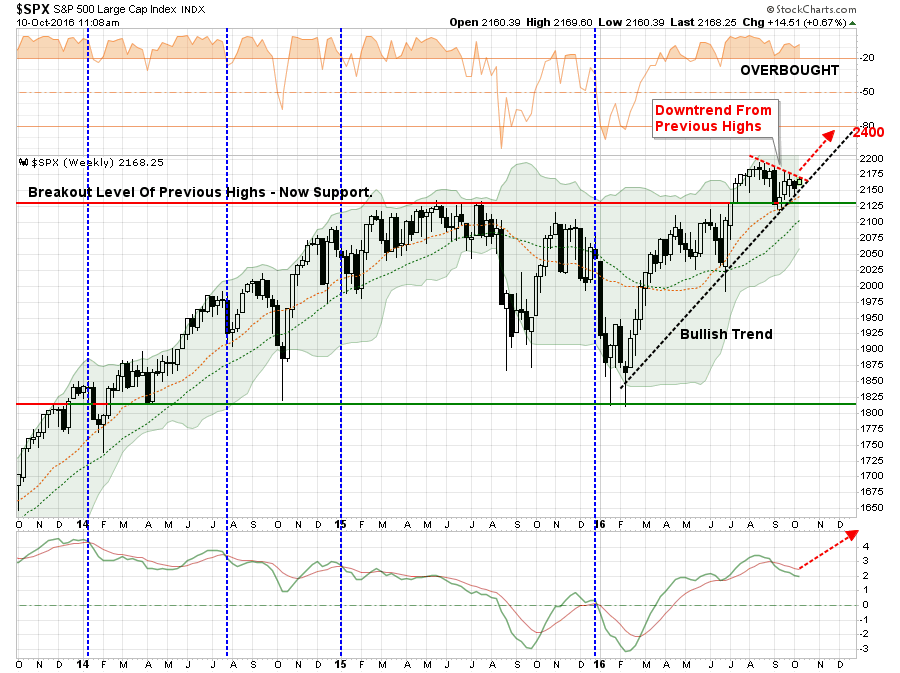
“For now, however, the markets remain stuck.”
However, a major decision point is rapidly approaching which will decide the fate of the market for the rest of the year.
In the daily price chart below the tightening consolidation of the market is evident.
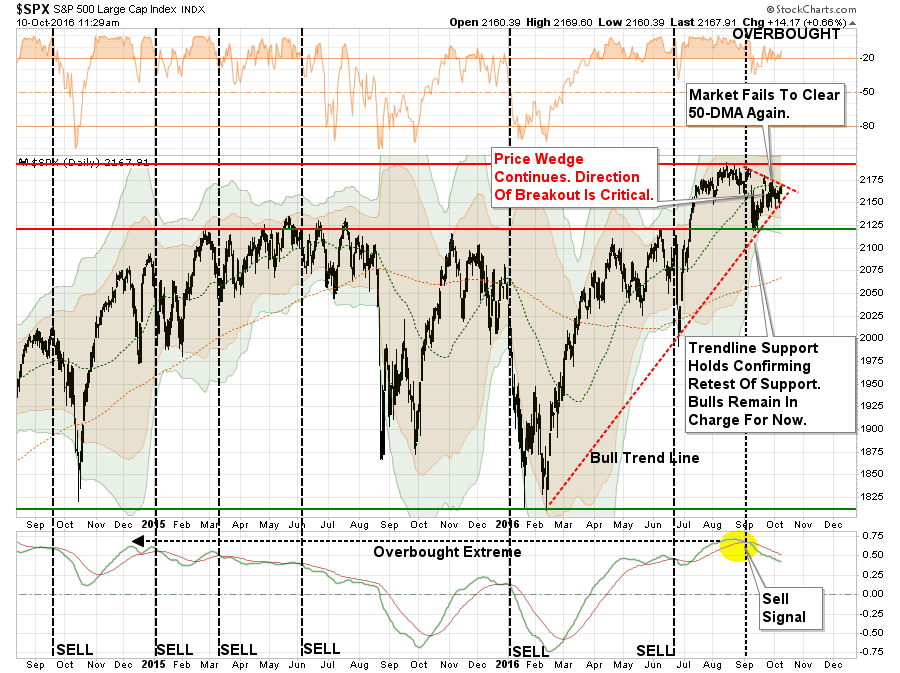
Notice in the bottom part of the chart the market currently remains on a sell signal. That sell signal is problematic for two reasons:
1) “Sell signals” combined with overbought conditions tend to lead to at least short-term corrections.
2) “Sell signals formed at very high levels, such as currently, suggests limited upside and larger correction probabilities.
Let’s zoom in on the recent price action in the chart above. The chart below is the last 3-months of daily price movement. As you will see, while prices have been quite volatile, there has been virtually no progress in the market during the period.
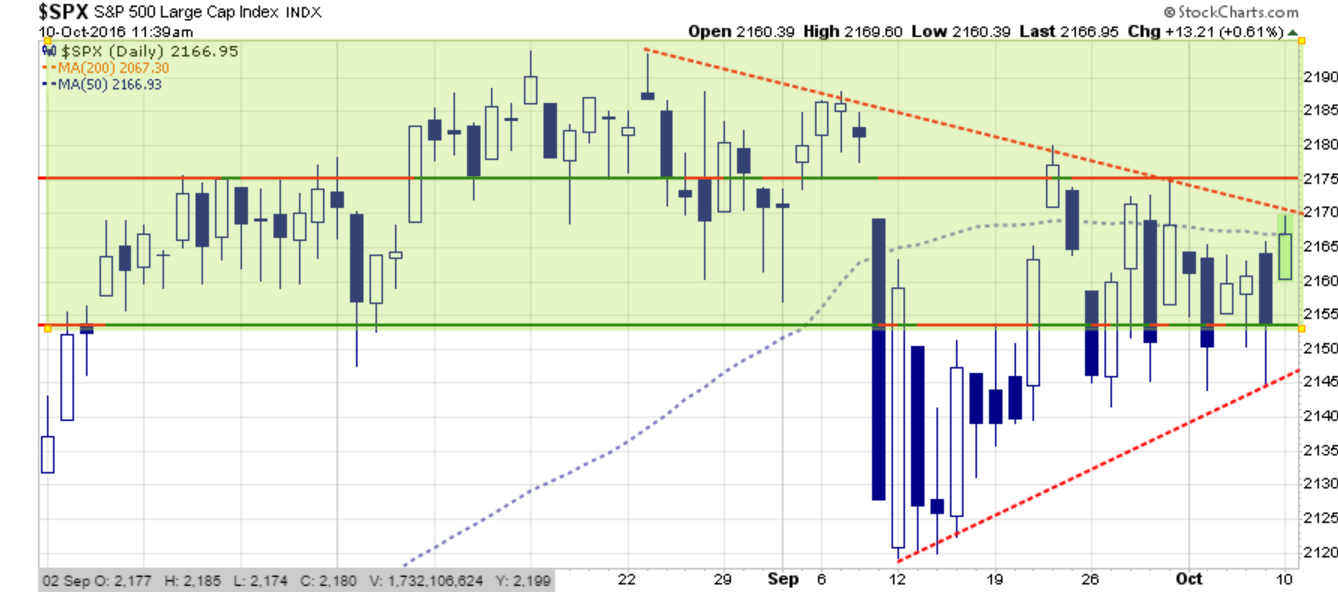
The two dashed lines so the tightening consolidation pattern more clearly. With the pattern becoming much more compressed it is quite likely a breakout is going to occur within the next few days. The direction of that breakout will be most important.
As I wrote last Tuesday, a breakout to the upside would likely see a push of the markets towards the targeted level of 2400. However, such a move would also require a real improvement in economic growth and earnings to remain supportive of those valuations. Otherwise, the move will likely be very short lived.
“A move to 2400 would once again stretch the limits of deviation from the long-term trend line likely leading to a rather nasty reversion shortly thereafter.”
Conversely, a break to the downside would likely signal a deeper correction in the works which would be consistent with failed expectations of stronger earnings and economic growth, a strong dollar, weaker commodity prices and lower interest rates. These retracement levels are shown below.
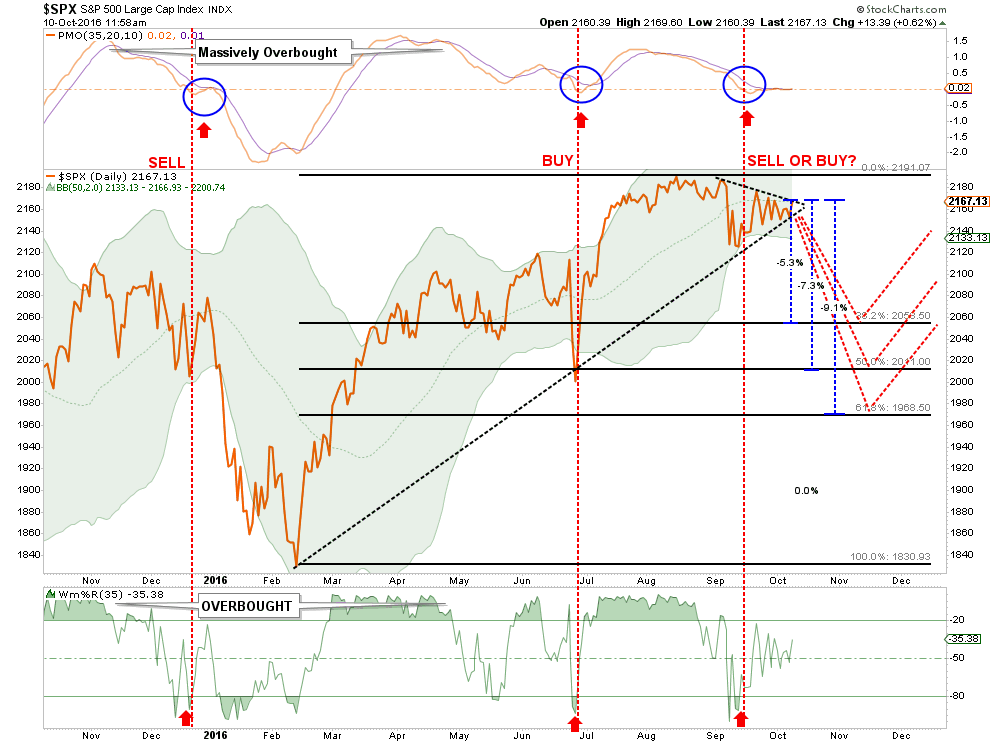
I have not only denoted the standard Fibonacci retracement levels, but also the depth of the correction associated with each. Importantly, from current levels, the deepest currently expected correction in the short-term would only be 9.1%. While this doesn’t even register on the scale of a “significant” correction, given the length of time without a 10%-plus correction it will likely “feel” far worse than it actually is.
Importantly, a breakdown in the markets from current levels have two negative short-term consequences:
- The market will provide a negative return year to investors which, for those depending on compounding returns at 6% annually, set back retirement goals.
- The “breakout” to new market highs will be nullified as the market returns back into its trading range that began in May of last year.
However, on a longer-term basis, the breakdown would also violate very important bullish trend lines which would denote a significant change in market trends. As shown in the chart below, the “megaphone” topping process, combined with weekly long-term sell signals, still remains. A downside correction that breaks the bullish trend line from the 2009 lows would suggest a broader reversion in the works.
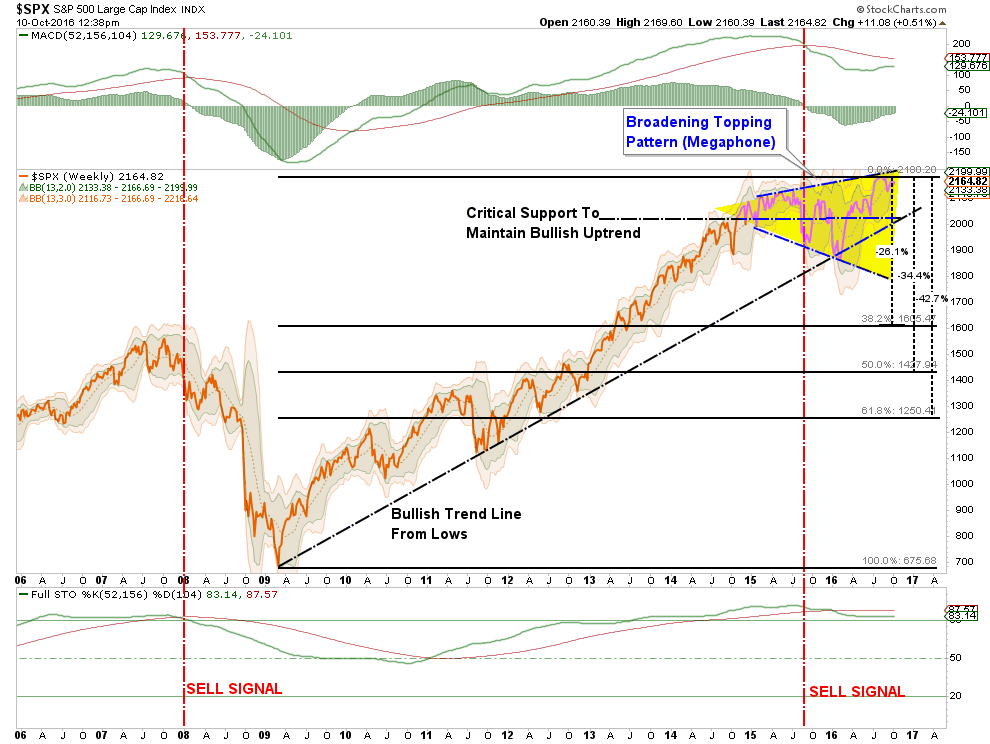
Once again applying a standard Fibonacci retracement to the current cyclical bull market, we find the next “bear market” could range from between 26.1% to 42.7%. Given the current extension of valuations, debt and leverage levels, and weak sales growth, a recessionary correction between 34.4% and 42.7% would not be extraordinary.
As stated, a correction of this magnitude would not be unprecedented and would coincide with the onset of the next recession. But therein lies the problem.
Elena Holodny recently penned the following note from a UBS team led by strategist Julian Emanuel:
“It is worth noting that no US equity bear market of the last 25 years has begun without a recession starting within 12 months following the market top.”
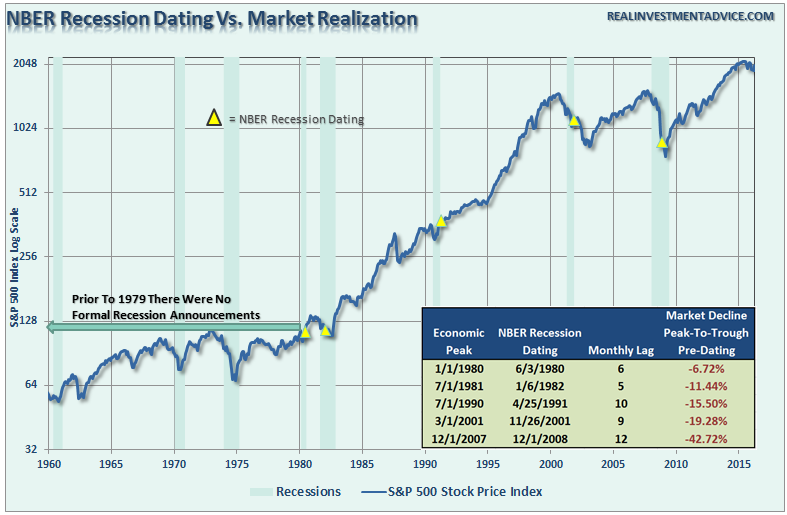
Unfortunately, that not exactly an accurate statement. As I noted previously in “Think Like A Bear, Invest Like A Bull:”
“However, the ‘lead effect’ is much more coincident in reality. This is due to the fact that recessions are only revealed in hindsight once data is revised lower. This lag effect of the data revisions in shown below.”
Which way is the market going to break?
I have no clue. And neither do you.
However, focusing my attention to a breakout to the upside, with portfolios already exposed to equities, is of little concern. It is the risk of a break to the downside that poses the most danger.
The current cyclical bull market is not over as of yet. Momentum driven markets are hard to kill in the latter stages particularly as exuberance builds. However, they do eventually end. That is unless the Fed has truly figured out a way to repeal economic and business cycles altogether. As we enter into the eighth year of economic expansion we are likely closer to the next contraction than not. This is particularly the case as the Federal Reserve continues to build a bigger economic void in the future by pulling forward consumption through its monetary policies.
Will the market likely be higher a decade from now? A case can certainly be made in that regard. However, if interest rates or inflation rises sharply, the economy moves through a normal recessionary cycle, or if Jack Bogle is right – then things could be much more disappointing. As Seth Klarman from Baupost Capital once stated:
“Can we say when it will end? No. Can we say that it will end? Yes. And when it ends and the trend reverses, here is what we can say for sure. Few will be ready. Few will be prepared.”
We saw much of the same mainstream analysis at the peak of the markets in 1999 and 2007. New valuation metrics, IPO’s of negligible companies, valuation dismissals as “this time was different,” and a building exuberance were all common themes. Unfortunately, the outcomes were always the same.
“History repeats itself all the time on Wall Street” – Edwin Lefevre
Disclosure: The information contained in this article should not be construed as financial or investment advice on any subject matter. Streettalk Advisors, LLC expressly disclaims all liability in ...
more


Thanks for sharing