
The good news is:
- The breadth indicators have joined the rally.
The Negatives
The first chart covers the last 6 months showing the NASDAQ composite (OTC) in blue and a 10% trend (19 day EMA) of NASDAQ new highs (OTC NH) in green. Dashed vertical lines have been drawn on the 1st trading day of each month.
OTC NH turned upward, but is trailing the upward move of the index..

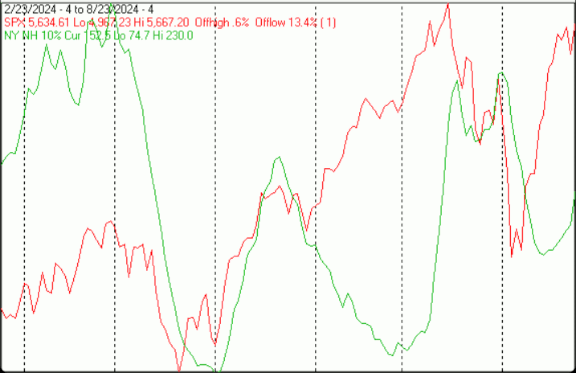
The next chart is similar to the one above except it shows the S&P 500 (SPX) in red and NY NH in green has been calculated with NYSE data.
Ditto NY NH.
The Positives
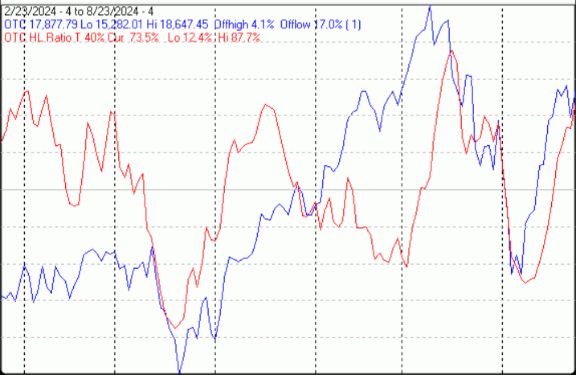
The next chart covers the past 6 months showing the OTC in blue and a 40% trend (4 day EMA) of NASDAQ new highs divided by new highs + new lows (OTC HL Ratio), in red. Dashed horizontal lines have been drawn at 10% levels for the indicator; the line is solid at the 50%, neutral level (equal numbers of new highs and new lows).
OTC HL Ratio rose to solidly positive territory.
(Click on image to enlarge)
The next chart is similar to the one above except it shows the SPX in red and NY HL ratio, in blue, has been calculated with NYSE data.
NY HL Ratio rose, finishing the week above 90%.
(Click on image to enlarge)

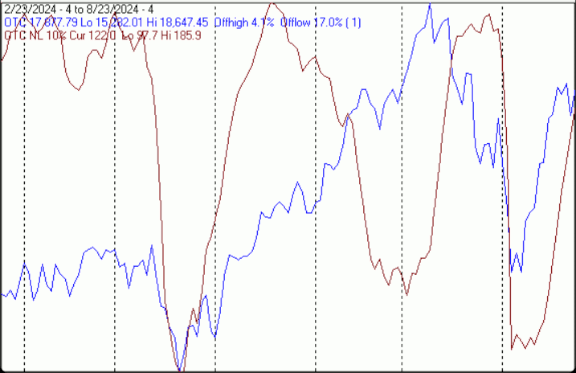
The next chart covers the past 6 months showing the OTC in blue and a 10% trend (19 day EMA) of NASDAQ new lows (OTC NL) in brown. OTC NL has been plotted on an inverted Y axis so decreasing numbers of new lows move the indicator upward (up is good).
OTC New lows finished the week at their lowest level since mid July.
The next chart is similar to the one above except it shows the SPX in red and NY NL, in blue, has been calculated with NYSE data.
NYSE new lows also disappeared last week.
(Click on image to enlarge)
Summation indices are running totals of oscillator values.
Short term momentum indicators applied to summation indices make them nearly binary.
The next chart covers the past 6 months showing the SPX in red and momentum of summation indices of oscillators of advancing and declining issues, new highs and new lows and upside and downside volume on the NYSE.
More By This Author:
Technical Market Report For August 17, 2024
Technical Market Report For August 10, 2024
Technical Market Report For August 3, 2024


Comments
Log in or sign up to join the conversation.