
The good news is:
- Last week's market mayhem was not anticipated by the breadth indicators so it is likely to be just a transitory anomaly.
The Negatives
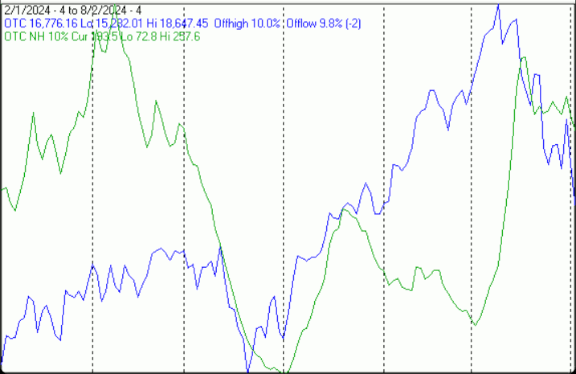
The first chart covers the last 6 months showing the Nasdaq composite (OTC) in blue and a 10% trend (19 day EMA) of Nasdaq new highs (OTC NH) in green. Dashed vertical lines have been drawn on the 1st trading day of each month.
OTC NH failed to confirm the all time index high a few weeks ago.
It gave no hints to what was going to happen last Thursday and Friday.
Its failure in June was because the index was driven up by a few very large cap issues.
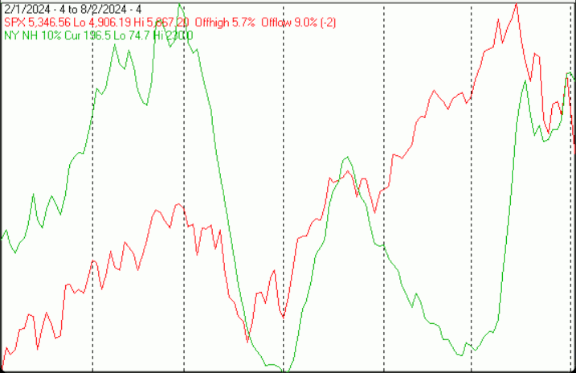
The next chart is similar to the one above except it shows the S&P 500 (SPX) in red and NY NH in green has been calculated with NYSE data.
NY NH also failed to confirm the SPX all time high.
It also offered not hint as to what happened Thursday and Friday.
The Positives
The next chart covers the past 6 months showing the OTC in blue and a 40% trend (4 day EMA) of Nasdaq new highs divided by new highs + new lows (OTC HL Ratio), in red. Dashed horizontal lines have been drawn at 10% levels for the indicator; the line is solid at the 50%, neutral level (equal numbers of new highs and new lows).
OTC HL Ratio remained in positive until Friday.

The next chart is similar to the one above except it shows the SPX in red and NY HL ratio, in blue, has been calculated with NYSE data.
NY HL Ratio also held up well in spite of a rough week for the SPX.
NYSE new lows did not outnumber new highs any day last week.

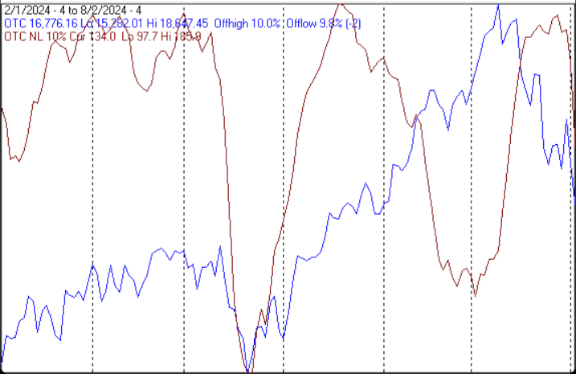
The next chart covers the past 6 months showing the OTC in blue and a 10% trend (19 day EMA) of Nasdaq new lows (OTC NL) in brown. OTC NL has been plotted on an inverted Y axis so decreasing numbers of new lows move the indicator upward (up is good).
New lows have been persistently high on the Nasdaq, but did not increase significantly until late last week. They did not anticipate the sharp decline in prices Thursday and Friday.
The next chart is similar to the one above except it shows the SPX in red and NY NL, in blue, has been calculated with NYSE data.
NYSE new lows did not reach threatening levels until Friday.

Summation indices are running totals of oscillator values.
Short term momentum indicators applied to summation indices make them nearly binary.
The next chart covers the past 6 months showing the SPX in red and momentum of summation indices of oscillators of advancing and declining issues, new highs and new lows and upside and downside volume on the NYSE.
NY SI MoM’s had all turned upward early last week.

The next chart shows just the last 2 months of the previous chart so you can see more clearly what is happening.

The next chart is similar to the NYSE chart above; except it shows the OTC, in blue and the SI MoM’s have been generated from Nasdaq breadth data.
OTC SI MoM’s have turned downward.
The next chart shows the last 2 months of the previous chart. After turning upward they all headed downward late last week.

Prior to around the turn of the century the NYSE advance – decline line (ADL) (a running total of daily declining issues subtracted from advancing issues) had a modestly negative bias. Around the turn of the century the bias became wildly positive.
The NYSE ADL hit an all time high last Wednesday.

Seasonality
Next week includes the 5 trading days prior to the 2nd Friday of August during the 4th year of the Presidential Cycle. The tables below show the daily change, on a percentage basis for that period.
OTC data covers the period from 1963 to 2023 while SPX data runs from 1953 to 2023. There are summaries for both the 4th year of the Presidential Cycle and all years combined. Prior to 1953 the market traded 6 days a week so that data has been ignored.
Average returns for the coming week have been positive by all measures and stronger during the 4th year of the Presidential Cycle than other years.
Report for the week before the 2nd Friday of Aug
The number following the year is the position in the Presidential Cycle.
Daily returns from Monday to 2nd Friday.
OTC Presidential Year 4 (PY4)
Year Mon Tue Wed Thur Fri Totals
1964-4 0.10% 0.17% 0.72% 0.47% 0.12% 1.58%
1968-4 -0.97% 0.40% 0.00% 0.42% -0.08% -0.23%
1972-4 0.02% -0.27% 0.11% 0.07% 0.64% 0.57%
1976-4 -0.34% 0.61% -0.09% 0.09% -0.09% 0.19%
1980-4 -0.35% 0.37% 0.54% 1.03% 0.37% 1.95%
Avg -0.31% 0.26% 0.32% 0.42% 0.19% 0.81%
1984-4 1.23% -0.07% -0.43% 0.93% 0.84% 2.50%
1988-4 -0.01% -0.88% -1.49% 0.16% -0.04% -2.27%
1992-4 -0.10% -0.27% -0.13% 0.02% 0.38% -0.10%
1996-4 -0.39% 0.75% 1.08% -0.32% -0.02% 1.11%
2000-4 2.00% -0.37% 0.13% -2.43% 0.78% 0.11%
Avg 0.54% -0.17% -0.17% -0.33% 0.39% 0.27%
2004-4 -0.13% 1.92% -1.45% -1.68% 0.27% -1.07%
2008-4 -1.10% 2.81% 1.21% -0.95% 2.48% 4.45%
2012-4 0.74% 0.87% -0.15% 0.25% 0.07% 1.78%
2016-4 -0.15% 0.24% -0.40% 0.46% 0.09% 0.23%
2020-4 -0.39% -1.69% 2.13% 0.27% -0.21% 0.11%
Avg -0.20% 0.83% 0.27% -0.33% 0.54% 1.10%
OTC summary for PY4 1964 - 2020
Avg 0.01% 0.31% 0.13% -0.08% 0.37% 0.73%
Win% 33% 60% 50% 73% 67% 73%
OTC summary for all years 1963 - 2023
Avg -0.29% 0.08% 0.16% 0.07% 0.04% 0.05%
Win% 46% 51% 60% 63% 49% 57%
SPX PY4
Year Mon Tue Wed Thur Fri Totals
1956-4 -1.57% 0.61% 0.41% -0.08% -0.47% -1.10%
1960-4 0.14% 0.58% 0.41% 0.37% 0.68% 2.18%
1964-4 -0.10% -0.02% 0.50% 0.29% -0.07% 0.60%
1968-4 0.23% 0.41% 0.00% -0.22% -0.03% 0.39%
1972-4 0.16% 0.07% 0.15% 0.17% 0.81% 1.37%
1976-4 -0.29% 0.89% -0.34% 0.15% 0.03% 0.45%
1980-4 -0.19% -0.20% 0.67% 1.44% 0.25% 1.97%
Avg -0.04% 0.23% 0.25% 0.37% 0.20% 0.96%
1984-4 0.15% 0.07% -0.59% 2.34% -0.07% 1.90%
1988-4 -0.43% -1.29% -1.72% 0.32% -0.08% -3.20%
1992-4 0.13% -0.12% -0.27% -0.01% 0.52% 0.25%
1996-4 -0.34% 0.33% 0.27% -0.24% -0.07% -0.06%
2000-4 1.12% 0.24% -0.67% -0.86% 0.79% 0.62%
Avg 0.13% -0.16% -0.60% 0.31% 0.22% -0.10%
2004-4 0.12% 1.30% -0.30% -1.17% 0.15% 0.09%
2008-4 -0.90% 2.87% 0.34% -1.79% 2.39% 2.91%
2012-4 0.23% 0.51% 0.06% 0.04% 0.22% 1.07%
2016-4 -0.09% 0.04% -0.29% 0.47% -0.08% 0.06%
2020-4 0.27% -0.80% 1.40% -0.20% -0.02% 0.66%
Avg -0.07% 0.78% 0.24% -0.53% 0.53% 0.96%
SPX summary for PY4 1956 - 2020
Avg -0.08% 0.32% 0.00% 0.06% 0.29% 0.60%
Win% 53% 71% 56% 53% 53% 82%
SPX summary for all years 1953 - 2023
Avg -0.28% 0.16% 0.10% 0.07% 0.07% 0.12%
Win% 42% 58% 54% 49% 52% 56%
Conclusion
Pricewise, last week was interesting.
Monday thru Wednesday looked like a breadth supported rally. Then Thursday and Friday turned into a frightening decline.
Since the decline Thursday and Friday was not anticipated by weakness in the breadth, I expect this period of weakness to be transitory.
The strongest sectors last week were Utilities (for the 3rd week) and Health care while the weakest were Electronics (for the 3rd week) and Banks.
I expect the major averages to be higher on Friday August 9 than they were on Friday August 2.
Last week's positive forecast was a miss.
More By This Author:
Technical Market Report For July 27, 2024Technical Market Report For July 20, 2024
Technical Market Report For July 13, 2024


Comments
Log in or sign up to join the conversation.