

Image Source: Unsplash
With artificial intelligence continuing to dominate the technology ecosystem, it’s no wonder that integrated circuit foundry Taiwan Semiconductor (TSM) has benefited handsomely from the broader demand surge. At the same time, TSM stock has already gained roughly 54% on a year-to-date basis, thus raising concerns about forward viability.
Within the financial publication industry, the two dominant methodologies are fundamental and technical analysis. While they can be instructive, the critical issue that must be recognized is that in either approach, both the premise and the conclusion stem from the author making the claim. In other words, they’re analyst-contingent methodologies.
For example, TSM stock currently carries a Strong Buy consensus rating. However, what’s fascinating is that the gap between the highest price target ($400) and the average price target ($340.75) clocks in at 17.39%. What’s more, the high-low gap is nearly 38%.
So, while the suits on the Street are all using fundamental analysis, some experts see robust growth while others see an erosion, This necessarily means that concepts such as intrinsic value are not universal truth claims but are dressed-up opinions masquerading as “analysis.”
In contrast, quantitative analysis aligns with the observations made by GARCH (Generalized Autoregressive Conditional Heteroskedasticity) studies, which describes the diffusional properties of volatility as clustered, non-linear phenomena. In other words, different market stimuli yield different market behaviors.
Now, under baseline conditions, the forward 10-week returns of TSM stock would be expected to form a distributional profile, with outcomes ranging from $290 to $338 (assuming an anchor price of $303.22, Thursday’s close). Further, price clustering would be expected to be predominant at about $310.
(Click on image to enlarge)
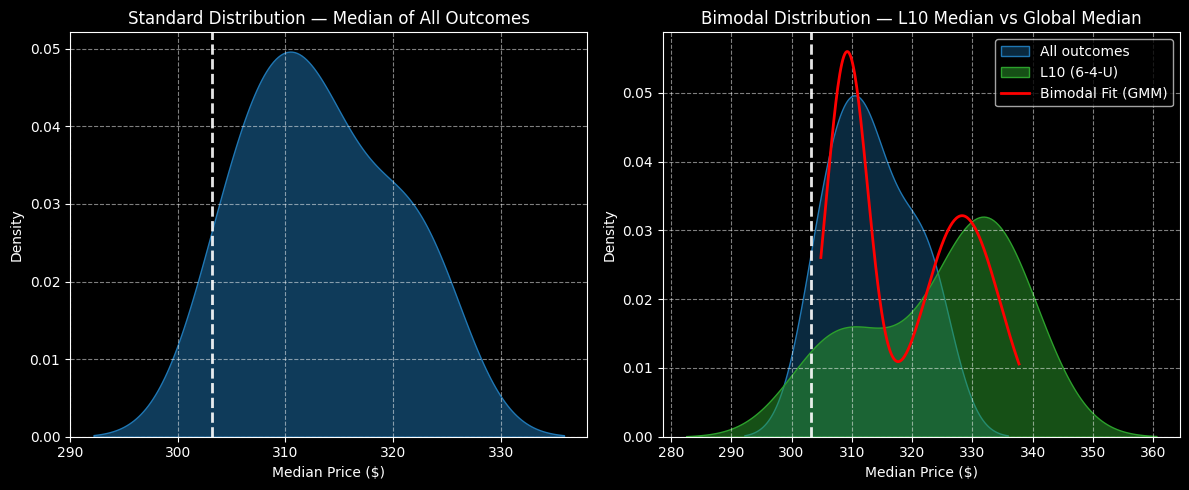
However, TSM stock is not under baseline conditions but has instead printed a 6-4-U sequence: six up weeks, four down weeks, with an overall upward trajectory. Based on this specific stimulus, the risk-reward tail expands to $282 on the downside to $360 on the upside. Moreover, price clustering would be predominant at $331.
Right now, investors are enjoying a 6.77% positive delta in price density dynamics — which is very much a measurable statistic. It’s just that fundamental and technical analysts are blind to it because such variances are not visible to the naked eye.
Granted, the sentiment regime can shift and investors will need to be aware of exogenous influences. Presently, though, the empirical data supports the upside narrative.
More By This Author:
Micron Technology Is Up Big This Year But It May Have Hit A Temporary Stall Point
The Perfect AI Stock Does Exist. It’s Microsoft.
Broadcom Both Benefits And Suffers From The AI Surge


Comments
Log in or sign up to join the conversation.