
T2108 Update – The Technical Case For A Bottom
(T2108 measures the percentage of stocks trading above their respective 40-day moving averages [DMAs]. It helps to identify extremes in market sentiment that are likely to reverse. To learn more about it, see my T2108 Resource Page. You can follow real-time T2108 commentary on twitter using the #T2108 hashtag. T2108-related trades and other trades are sometimes posted on twitter using the #120trade hashtag. T2107 measures the percentage of stocks trading above their respective 200DMAs)
T2108 Status: 21.3% (ends 6-day oversold period, the 3rd oversold period in 12 trading days)
T2107 Status: 34.2%
VIX Status: 22.0 (gap down from failed attempt to hold 2012 highs, 21 is the buy signal)
General (Short-term) Trading Call: Shorts should exit when/if 200DMA resistance gives way (should have already taken profits during the oversold period!); aggressive traders OK to take some profits on longs bought during oversold period; conservative traders can continue to wait for 200DMA resistance to fail, not worth the risk to enter upon end of oversold period. See below for details.
Active T2108 periods: Day #1 over 20% (ends 6-day oversold period), Day #19 under 30%, Day #25 under 40%, Day #27 under 50%, Day #29 under 60%, Day #71 under 70%
Reference Charts (click for view of last 6 months from Stockcharts.com):
S&P 500 or SPY
SDS (ProShares UltraShort S&P500)
U.S. Dollar Index (volatility index)
EEM (iShares MSCI Emerging Markets)
VIX (volatility index)
VXX (iPath S&P 500 VIX Short-Term Futures ETN)
EWG (iShares MSCI Germany Index Fund)
CAT (Caterpillar).
Commentary
Sometimes, good technical fundamentals are exactly what you need to maximize your trading…
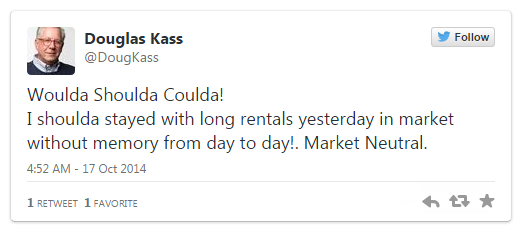
I responded but to the wrong tweet…
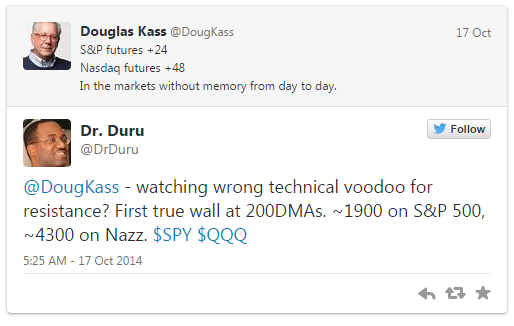
And in turn, I had THIS earlier tweet on my mind when I sent my response.
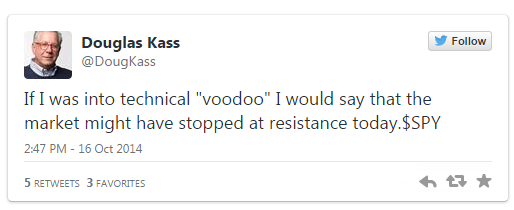
It was not clear to me what technical resistance concerned the voodoo doctors, but I believe MOST technically-minded people are singularly focused on the 200-day moving averages (DMAs) and now the flatline levels for 2014. I am of course even more focused on T2108. Let’s dive right in to the story with charts.
This was a day to celebrate as the oversold period finally ended a particularly difficult period of churn. I am going to lay out a case for a sustainable bottom but not THE absolute bottom.
T2108 finally emerged from oversold territory, but it wavered into the close. I half-worried it would sink again under the 20% oversold threshold. Big relief over small favors.
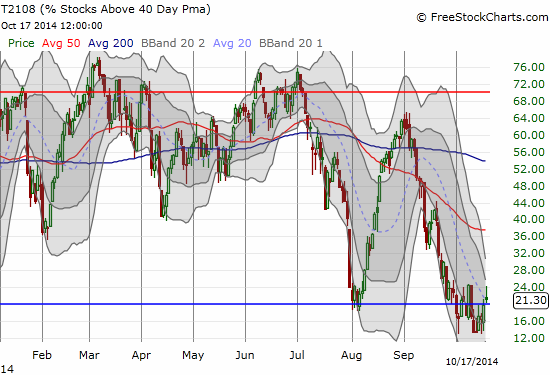
The last of three oversold periods finally ends at 6 days
The pattern is VERY sloppy, but it looks like T2108 is finally stabilizing. I do not think it is going lower anytime soon even if T2108 drops into oversold territory again. Recall that the period of seasonal weakness for stocks generally ends with October. (I will soon trot out the Black Friday analysis to make this point even more poignant).
The percentage of stocks trading above their 200-day moving averages (DMAs), T2107, still has a downtrend to wrestle, but at least it has strung together two very solid days for the first time since August.
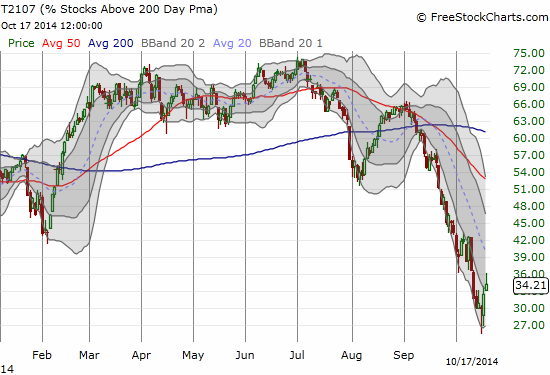
T2107 is also attempting to bottom
Both the S&P 500 (SPY) and the NASDAQ (QQQ) struggled as expected following Wednesday’s steep sell-off and equally steep comeback. However, “the line in the sand” held firm and the indices printed their best 2-day performances in a very long time.
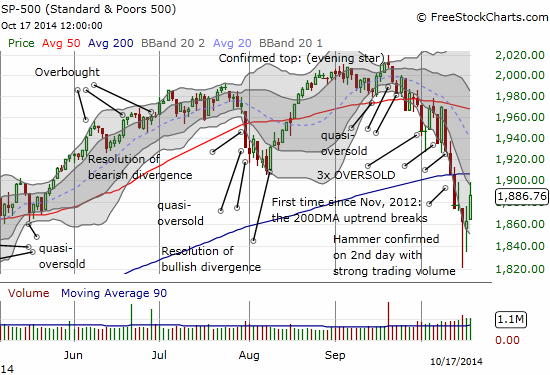
The S&P 500 rallies out of oversold conditions but essentially fails to break through 200DMA resistance
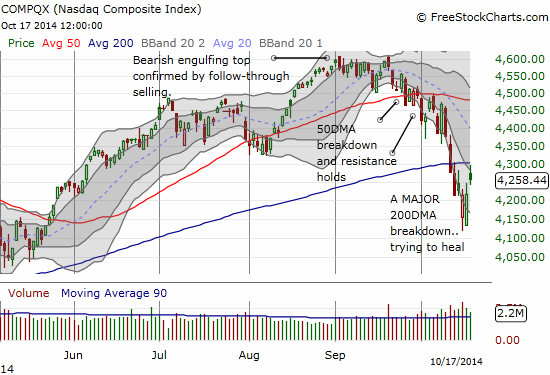
The NASDAQ gaps away from its lows but falls short at 200DMA ressitance
The major indices continue to face similar technical challenges as 200DMA resistance held very firm for both. This is clearly a setback, but I am also not surprised that the indices were unable to both hurdle out of oversold conditions AND conquer key technical resistance all on the same day. The proximity of the end of the oversold period and resistance at the 200DMA is exactly the scenario I warned “conservative traders” about. There is little point in buying now hoping that the markets overcome resistance before you lose your nerve. The better risk/reward is still in the waiting.
Further supporting a bottom is what looks like a blow-off top of volatility. Note very well that the VIX failed to hold above 2012 highs TWICE and on the third day it gapped down in what looks like an exhaustion of fear. These movements translated into some very bearish fade action on UVXY. I flagged this potential in the last T2108 Update.
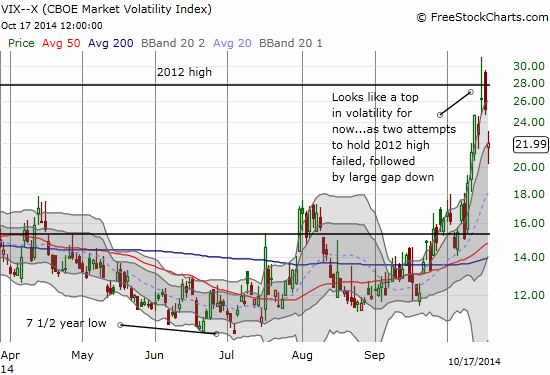
The VIX fails to hold 2012 highs – a bullish sign
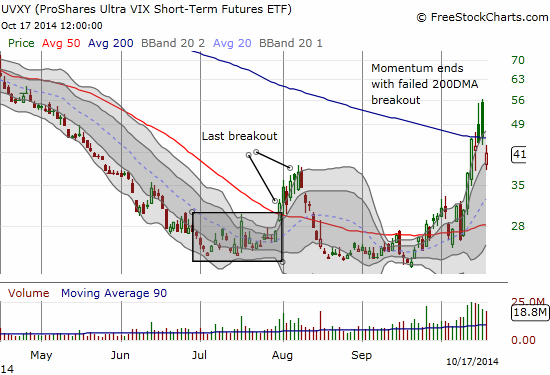
Similarly, UVXY fails to hold 200DMA support
Note very well I am NOT claiming the markets will no longer be volatile. I think the days of ultra-low volatility are decidedly over for now. I AM expecting a good respite from growing or even accelerating volatility.
The currency markets are also indicating subsiding angst. My favorite indicator on this score – the Australian dollar versus the Japanese yen (AUD/JPY) – would simply not stay down this past week. While the downtrend is still in place, sellers have not been able to maintain a hold on the breakdown.
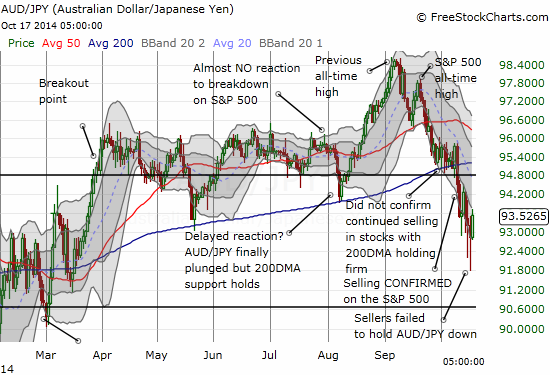
The Australian dollar is starting to hold its own against the Japanese yen even as the overall downtrend from recent highs remains intact
Overall, these collection of signal says at least that sellers and fear are tiring. Since volatility is likely to remain elevated, it is very likely that lows could be retested in the near future before the market is able to make a firm run through resistance. Buyers and bulls still have a LOT to prove going forward.
Now I turn the storytelling over to some tell-tale individual stocks.
I have not had a lot to say about Apple (AAPL) in recent days and weeks as the stock mainly churns about in a range. This week, on October 15th, AAPL finally broke down with follow-through seling before buyers came to the rescue. After a gap down and a gap up, AAPL is barely clinging to the bottom edge of the trading range. It is also now travelling in a budding downtrend. AAPL has remained overall resilient during the sell-off in the last month. I am watching closely as I think a fresh sell-off in AAPL could flag fresh weakness in market sentiment. Similarly, a resumption of the previous uptrend would be a very bullish development. Earnings are coming up after-market October 20th – I hope to get a pre-earnings trade review done soon.
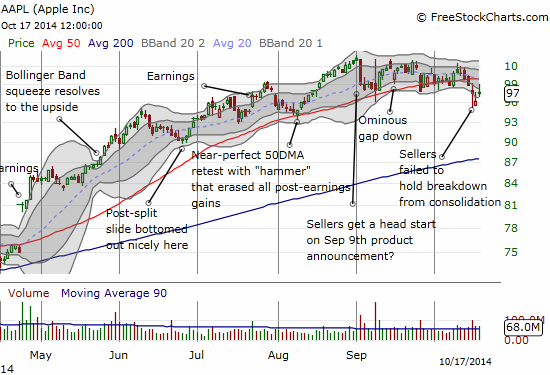
AAPL clings to the bottom of its recent trading range
I am still leery of the apparent triple top in Baidu (BIDU), but this week’s impressive bounce from a bullish engulfing pattern has me thinking BIDU may garner enough buying support to break through resistance. Next stop is the 50-day moving average.
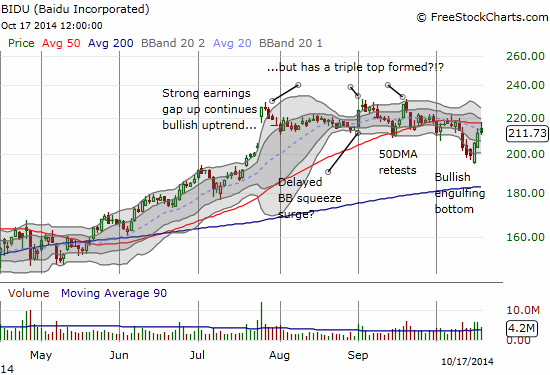
BIDU makes a statement with strong buying volume o the heels of a bullish engulfing pattern
Caterpillar, Inc. (CAT) finally broke its steep (and primary) downtrend. The 2011 close may indeed end up being the bottom for now. Earnings will occur before the open on October 24th – I will be watching the reaction as a key “final” confirmation of market sentiment. In particular, a clean breakdown below the 2011 close opens up the possibility of a complete reversal of the 2013 breakout back to around $85. I took profits on my CAT calls and switched back to a put spread as a “just in case” CAT’s earnings are a complete disaster and help take the market for another loop.
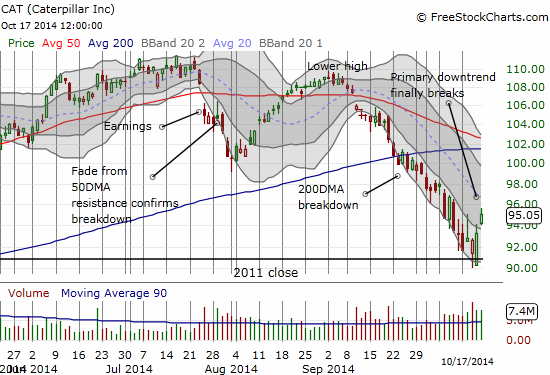
Caterpillar tries to show signs of life.
The disaster of the week had to be Netflix (NFLX). However, the washout of sellers may turn this collapse into an opportunity assuming the oversold bounce continues from current levels. I last wrote extensively about NFLX in early July. I remained stubborn with my short position backed up with periodic hedges with call spreads (amazingly, all but one I closed out with good gains). My stubbornness paid off big-time as NFLX severely disappointed on earnings this past week.
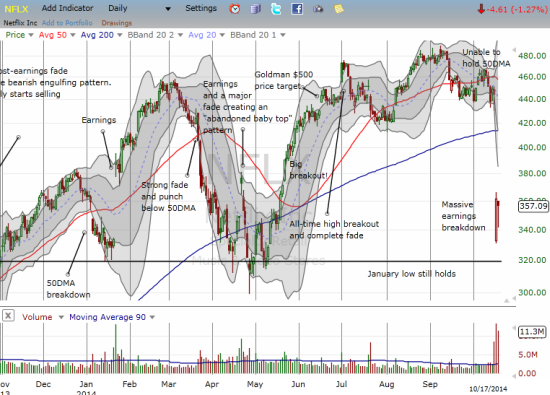
Netflix collapses BUT it still holds 2014 lows
I closed out my short position in after hours trading because I did not want to deal with what I assumed would be a rush of buying and short-covering at market open. Sure enough, the opportunity now is in the high volume bounce from lows (note the high volume BEFORE earnings – someone “knew” something). First, NFLX is so far below its lower-Bollinger Band (BB) that I fully expect it to tag the lower-BB before resuming any downward momentum. I flipped in and out of a long position on Friday with that expectation in mind (still kicking myself that I did not move fast enough on Thursday to do the same). The next opportunity is that IF NFLX somehow manages to make a fresh post-earnings low, the move will be a resounding confirmation of a new bearish run for NFLX. I continue to stay on high alert on NFLX.
There are no absolute cases for bottoms in these individual stocks, just encouraging signs. They are each making valiant attempts to bounce from bottoms which could be tell-tale signs to confirm the battle that will now unfold between 200DMA resistance and recent lows for the S&P 500 and the NASDAQ. For tech, AAPL needs to hold its trading range. For industrials, CAT needs to hold the 2011 low. If the market manages to plunge into a new oversold period that takes out the current lows in the indices, we will then know that “this time is indeed different.” As always, I take this one step at a time.
The final element of bottom-fishing is the market’s reaction to bad news. As I noted in the last T2108 Update, the market abruptly moved from caring about nothing to caring about everything. Most investors and traders may have missed it, but a major washout of negative sentiment may have occurred well before the market opened on Thursday, October 16th.
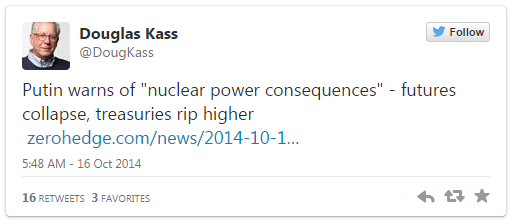
It turns out that Putin was NOT threatening to lob nuclear weapons. Instead, he made a thinly veiled threat referencing the dangers of nuclear powers saber-rattling over Ukraine. Moreover, this was the SECOND time Putin made such references. Putin made it clear to the world that Russia will not be bowed by attempts to isolate it. I am not sure who still pays attention to zerohedge beside Kass, permabears, “apocalypsists”, and various fear-mongerers, but I feel for anyone who panicked at that headline or similar ones and joined the stampede in thin pre-market trading. They got an extreme case of whiplash by the close when the S&P 500 ended the day flat after some gyrations. Even Kass bought into that panic as he made clear later in the day with his recount of his fast-trigger day-trading. His reference to half-regret for selling too early was from a position he put on accepting shares from a panicking market.
Anyone following the oversold indicators would have known the extreme danger of selling short into a further extreme in sentiment. They should have also known that selling into a panic rarely produces satisfactory results. However, I am honestly not even sure whether futures really “collapsed.” When I look at currency markets, I see absolutely no evidence of a market in panic. (A reminder of why it is useful to have multiple technical signals that can confirm each other). Anyway, whatever happened, I like this little example of market sentiment in action. I hope my regular readers will never make trading or investing decisions to satisfy any urges to panic. Heck, please NEVER panic if you can help it!
I conclude with a summary of trading strategies for my three trading archetypes:
The conservative “wait and see” trade
Conservative traders should continue to stay happily on the sidelines. T2108 has emerged from oversold conditions, but the indices are too close to important 200DMA resistance to make trades/investments worth the risk. Wait now for a confirmed close ABOVE the 200DMAs.
The growling bear trade
Stubborn bears who have held through all the oversold churn can still sit on their hands. If they followed the oversold trading rules, they can be even more patient having already taken a bunch of profits during the oversold period. Even though I think a sustainable bottom is in place, the bears still hold the upper-hand on sentiment and on the technicals. Buyers and bulls still have a LOT of repair work to accomplish.
The aggressive trade
Again, I fall mainly in this camp even as I use the logic of the growling bear to justify the hedges. The aggressive trader follows the T2108 rules to be a strict contrarian against extremes in fear and complacency. This is the fear stage. I bought during the oversold churn and the emergence from oversold conditions gave me an opportunity to finally take some profits on SSO call options. Given the extensive length of the oversold period, I switched to SSO shares for my “hold.” This last oversold period was much longer than usual, so I had to part with a large fistful of SSO calls that expired worthless. Only profits from hedges and the successes from the first two oversold periods eased my pain on those!
This last difficult oversold period does not change my strategy one bit because I am focused on the overall history of T2108 behavior. I am holding the SSO shares in the expectation that the market will “eventually” resume a run-up toward overbought conditions. This could of course change if the market makes fresh lows. In the shorter-term, I am still holding onto some put options on UVXY.
Jim Cramer of TheStreet.com and CNBC fame provided a great trading analogy in his fantasy football predictions for this weekend: go contrary to the grain – don’t give up on star fantasy football players just as they are about to perform.
Daily T2108 vs the S&P 500

Black line: T2108 (measured on the right); Green line: S&P 500 (for comparative purposes)
Red line: T2108 Overbought (70%); Blue line: T2108 Oversold (20%)
Weekly T2108

*All charts created using freestockcharts.com unless otherwise stated
Full disclosure: long SSO shares, long UVXY puts, net short the Australian dollar, long CAT put spread.


