
Supercore PCE Is The Weakest Since August
Jerome Powell and his Fed colleagues breathed a sigh of relief Friday morning as the PCE inflation report was weaker than expected. The headline PCE price index was +0.0% versus expectations of a 0.1% increase and a previous monthly change of +0.3%. The Core PCE was +0.1%, also a tenth below expectations. Recent inflation data provides hope that the trend lower in inflation will resume after stalling out for about six months. Further encouraging is the newly popular Supercore PCE reading, a subset of inflation, which was only up 0.1%. This index surged by 0.8% in January, causing the Fed and the market to reduce their expectations for a Fed rate. This report provides further evidence that the instance was a one-time spike and not likely a trend reversal.
Supercore prices, accounting for roughly 50% of PCE, include the prices of core services, excluding housing. The Fed has mentioned Supercore PCE on numerous occasions. Their rationale for following it is that many of the categories in the Supercore calculation are labor-intensive sectors. Therefore, Supercore PCE is a decent indicator of tightness in the labor markets, which can impact wages and, ultimately, inflation. The graphs below, courtesy of ZeroHedge, break out Supercore by its components. If it weren’t for health insurance, Supercore PCE would have been negative. Five of the eight components are negative, with one at essentially zero and two (healthcare and food service/accommodations) positive.

What To Watch Today
Earnings
- No notable reports today.
Economy
Market Trading Update
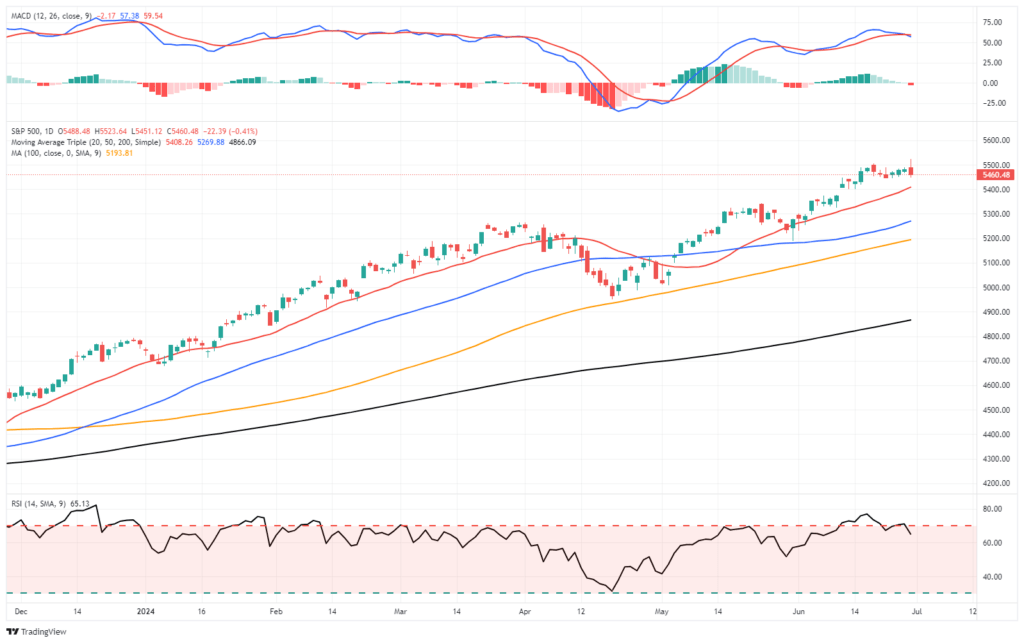
Last week, we did an in-depth discussion of the worsening breadth of the market. However, the important point was that investors make two mistakes regarding such data. To wit:
“The first is overreacting to these technical signals, thinking a more severe correction is coming. The second is taking action too soon.
Yes, these signals often precede corrections, but there are also periods of consolidation when the market trades sideways. Secondly, reversals of overbought conditions tend to be shallow in a momentum-driven bullish market. These corrections often find support at the 20 and 50-day moving averages (DMA), but the 100 and 200-DMAs are not outside regular corrective periods.
If you remember, in March, we discussed the potential for a 5% to 10% correction due to many of the same concerns noted above. That correction of 5.5% came in April. We are again at a juncture where a 5-10% correction is likely. The only issue is that it could come anytime between now and October. As is always the case, timing is always the most significant risk.”
As shown, the market’s monthly seasonality supports that view of a potential correction later this summer. July tends to be a decent performance month, with an average return of more than 2%.
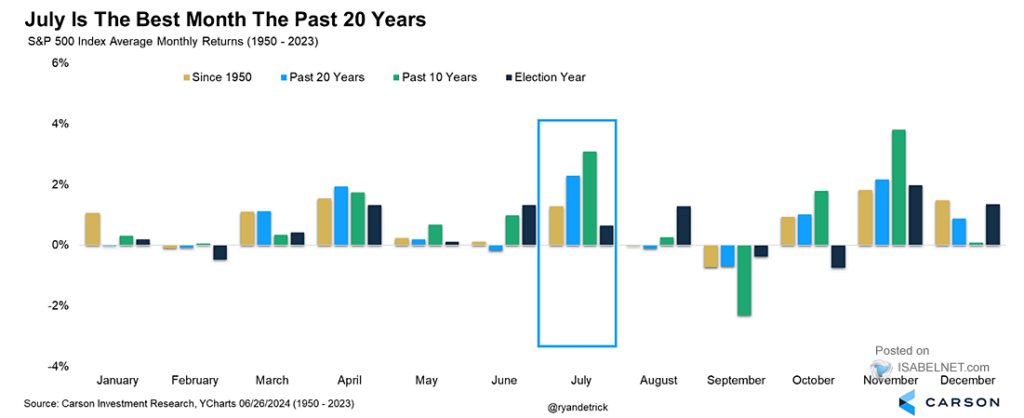
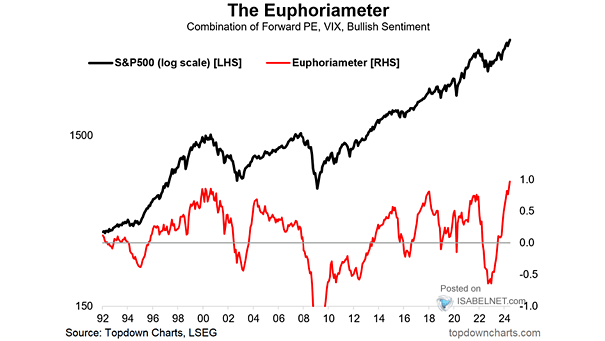
That boost in performance in July is supported by the kick-off of the Q2 earnings season. Such is particularly the case as investor sentiment is extremely bullish, which will continue to put a bid under stocks in the short term.
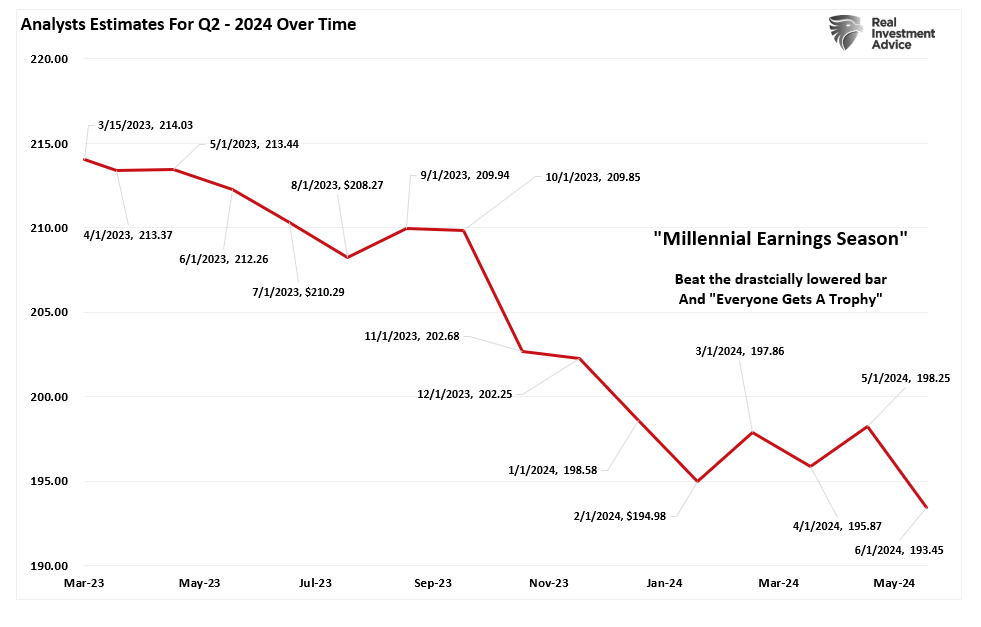
Speaking of earnings, analysts have been extremely busy over the last 30 days, slashing estimates. In June, Q2 earnings estimates for the S&P 500 index were cut by $5/share to the lowest level yet. Interestingly, while Wall Street continues to boast confidence in rising asset prices, they have cut estimates from $214/share in March last year to just $193/share. Such suggests a dichotomy between expected market performance and the economy, which is where earnings come from.
Nonetheless, the market remains overbought short-term and has triggered a short-term MACD “sell signal,” which could limit the upside in the near term. Continue to manage portfolio risk accordingly, but the bullish trend remains intact for now.
(Click on image to enlarge)
The Week Ahead
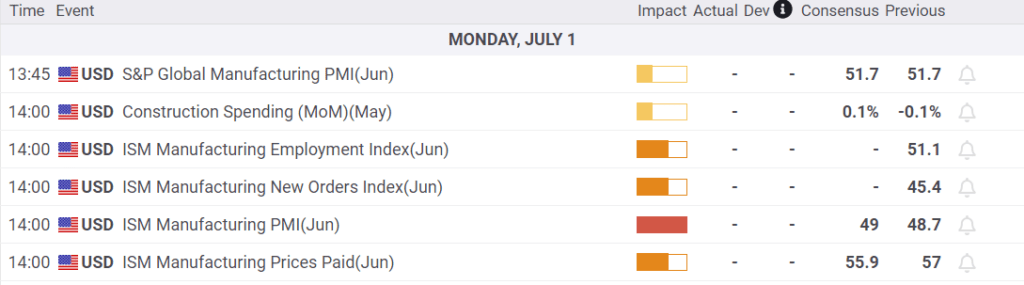
Despite the holiday-shortened week, investors will have plenty of economic data to digest. The ISM manufacturing survey will be released on Monday, and the services survey will be released on Wednesday. After Friday’s robust Chicago PMI survey, investors will look for confirmation in the ISM reports. Employment data, including JOLTs on Tuesday, ADP on Wednesday, and the BLS employment report on Friday, will be the most critical data points of the week. Recent jobless claims data point to some weakness in the labor markets.
Jerome Powell will be speaking on Tuesday at 8:30. By that time, he may have a good sense of what the BLS employment report holds. Further, investors will be looking to see if the recent weakness in economic data is starting to sway the Fed’s comfort regarding cutting rates. The next Fed meeting is July 31st.
Nike and Walgreens Tumble On Weakening Sales
Nike and Walgreens’ off-calendar earnings highlight a continuation of weakening personal consumption. In late May, we discussed this troubling theme in retail and food services earnings. Those Commentaries can viewed HERE and HERE.
On Thursday night, Nike disclosed that it bettered earnings expectations by .17 cents due to cost-cutting. However, it missed revenue forecasts by $250 million. Furthermore, they guided expectations down for fiscal year 2025. Nike can no longer hike prices to keep up with inflation, which indicates that the consumer is becoming more frugal. They also speak to weakness in China. Many companies have echoed similar sentiments about China’s economy.
NIke’s poor earnings are not just about slowing consumption. It also appears that “lifestyle brand competitors” are taking market share from Nike. Per the CEO:
There was a shift in our lifestyle brands that caught us by surprise, and without new products, we’ve had less interest. Newness is driving the consumer and we’ve got to move to more newness. We are also chasing our competition in women’s apparel and running. We said last quarter we had a new playbook that will start our comeback with new innovations. We aren’t there yet, and our numbers are going to be worse in 2025 than we previously thought.
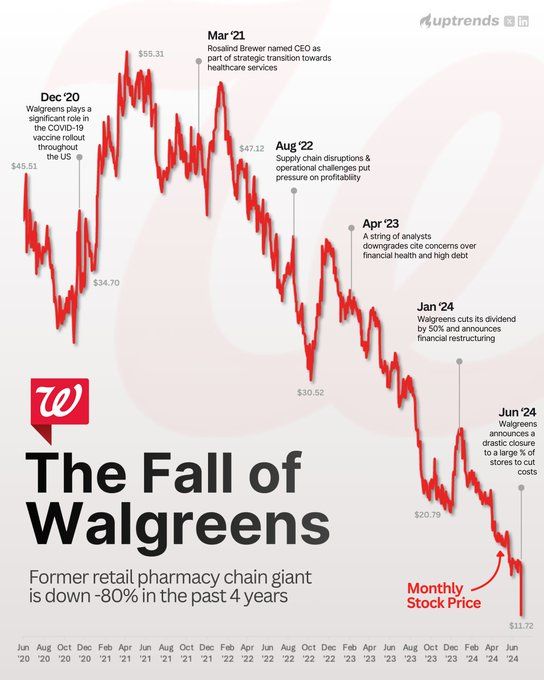
Walgreens also struggles partly due to weaker consumption. Like Nike, it is losing market share due to its business model. They reported earnings of $.63, $.05 short of estimates. However, revenues were slightly better than expected. While revenues were okay, they lowered EPS guidance from $3.20-$3.35 to $2.80-$2.95. Further, they are Closing 25% of their 8,600 stores over the next three years, which will lead to a decrease of 57,000 employees.
“We assumed the consumer would get somewhat stronger,” but “that is not the case,” said Walgreens CEO.
In regards to their business model, he states:
We are at a point where the current pharmacy model is not sustainable, and the challenges in our operating environment require we approach the market differently.
As we share below, NKE opened trading about 15% lower on the news last Friday and is at five-year lows. Walgreens is down about 20% since earnings. It has declined by 80% over the last five years, sitting at its lowest price since 1997!
(Click on image to enlarge)

(Click on image to enlarge)
Tweet of the Day

More By This Author:
The Confidence DichotomyCognitive Dissonance Is On Full Display
Will Japan Dump U.S. Treasury Securities?
Disclaimer: Click here to read the full disclaimer.


