
Stock Market & Economy Recap - Saturday, July 17
S&P 500 Earnings Update

S&P 500 earnings per share (EPS) increased to $200.07 this week. The forward EPS is now +25.8% year-to-date. Only 8.2% of the index has reported Q2 earnings so far, but the results remain stellar. 90% have beaten EPS estimates by a combined +19.2% above expectations.

The S&P 500 declined -0.97% this week.

S&P 500 price to earnings (PE) ratio is now at 21.6x.

The S&P 500 earnings yield is now 4.62%, compared to the 10-year Treasury bond rate that declined to 1.30%. The S&P 500 remains reasonably valued compared to fixed income alternatives.
Economic Data Review

The NFIB Small Business Optimism Index increased to 102.5 in June. 7 of the 10 index components improved for the month.102.5 represents the highest reading in nine months, and it sits above the historical average of 98.4.

Small business owners continue to have difficulty filling open positions, as the percentage of firms with unfilled positions continues to be a drag on the entire index. 46% of small businesses now have at least one unfilled position, a modest downtick from last month's record high but still well above anything we have seen.
As for inflation, 47% of owners report raising average selling prices in June, the highest reading since January 1981. And a net 44% of owners plan on price hikes in the near future.

The Consumer Price Index (CPI) increased 0.9% in June, this was the largest monthly increase since June 2008. On an annualized basis, CPI inflation is now +5.3% (up from +4.9% last month).

The Consumer Price Index minus food & energy costs (Core CPI) also increased +0.9% for the month. On an annualized basis, Core CPI is now +4.5% (up from +3.8% last month). This is the highest annualized Core CPI reading since November 1991.
The price increases were broad-based across all categories, but the biggest increases came from energy/gasoline prices (+44% annualized), & used cars and trucks (+45% annualized).

The Producer Price Index (PPI) increased 1.0% in June, an annualized increase of +7.3% (up from +6.6% last month). Producer inflation continues to run hotter than expected. PPI is seen as a leading indicator of inflation since producers generally raise selling prices on consumers to cover the extra costs.

Industrial Production increased +0.4% in June, below street expectations of +0.6%, and +9.8% over the last 12 months. Industrial Production has now recovered 92.8% of the COVID-19 decline.

Capacity utilization increased to 75.4, a post-COVID-19 high point. It’s clear that supply chain disruptions continue to suppress total growth potential.
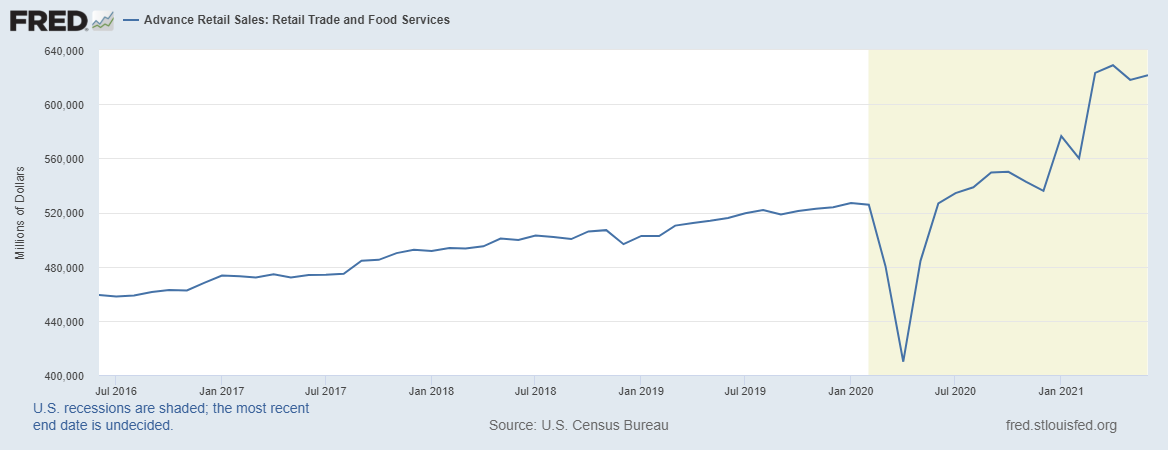
Total Retail Sales increased +0.6% in June to $621.3 billion. The street was expecting a decline of -0.4%. Total retail sales is up +18% from June 2020 results. Over the last 12 months, the biggest contributors to the overall growth was Clothing & apparel (+47%), Food Services (+40%), Gasoline (+37%), Electronics & appliance stores (+37%), and Motor Vehicle & parts dealers (+19%).
Notable Earnings

Financial services company BlackRock (BLK) was the standout this week. The company reported adjusted EPS of $10.03, a growth rate of +32% and 6.3% above street expectations.

Revenues came in at $4.82 billion (a quarterly record for the company), which is a growth rate of 32% and +4.2% above street expectations. Operating income grew to $1.931 billion, a gain of +37%, as operating margins increased from 38.5% to 40.1%.
Total assets under management hit a record $9.49 trillion for the quarter, up +30% from $7.32 trillion in Q2 2020 as a result of market gains and inflows into its financial products.

BlackRock has now reported $18.065 billion in revenue over the last four quarters (trailing twelve months – TTM), a record high for the company.

While TTM net income has risen to $5.489 billion.

As the world's largest asset manager, BlackRock has been one of my favorite non-tech/consumer stocks. It’s not easy to find a company that grows earnings by 12% and revenues by 10% annualized over the last 10 years, with 30%+ profit margins, strong returns on invested capital, impressive competitive advantages, and little debt.
The stock isn’t cheap but its not terribly expensive either, especially against the backdrop of an S&P 500 that has doubled in value over the last 15 months. I’d add to positions if the stock price fell to the low $800’s to high $700’s.
Chart of the Week

Source: JP Morgan Guide to the Markets Q3 2021
The US stock market now makes up 59% of the world's total invest-able market. To put this in perspective, in 1900 the US accounted for only 15% of the world's stock market. Today, the US market is more than triple the size of the entire Eurozone plus the UK. Despite all the current and future potential problems, the demand for US dollar denominated assets (including treasury bonds/government debt) has never been higher.
Summary
I was pleasantly surprised to see the Small Business Optimism index increase back above the historical average. Now both small business and consumer optimism are coming back, and that bodes well for the continued expansion. Inflation will remain a challenge, but rates have remained surprisingly low. The biggest risk is if the Fed has to begin reversing course sooner than the market anticipates.
I anticipated the Fed would begin to “taper” its monthly bond buying program before the end of the year, since its much easier than raising rates. But Fed Chair Powell reiterated this week that the committee isn’t even considering this yet. I think this could be a mistake. It’s easier to gradually remove stimulus. If the Fed waits too long, it runs the risk that they fall behind, and they would then need to adjust policy at a much faster pace, which could be disruptive to markets. But that’s still a ways off.
Overall, the fundamental picture remains solid. Earnings are great and interest rates are still nowhere near high enough to threaten the expansion. Q2 will likely see peak earnings and economic growth. Watch for more “is this as good as it gets?” rhetoric coming our way.
While the growth rate will moderate from here on out, I anticipate that growth will remain above average for awhile. But don’t be surprised if the peak growth “scare” could be good for a temporary market correction. If it happens, it would be perfectly normal and healthy.
Next Week
About 15% of the S&P 500 will be reporting earnings. I’ll be paying attention to Netflix (NFLX) on Tuesday, ASML (ASML), Microsoft (MSFT), & Tesla (TSLA) on Wednesday, and D.R. Horton (DHI) on Thursday. For economic data we have the CB Leading Economic Index (LEI) on Thursday.
I/B/E/S data is from Refinitiv.
Disclaimer: None.


