
The New York Stock Exchange (NYSE) is a very broad measure of the stock market with over 2400 companies listed. So when the NYSE begins to underperform, market participants should pay attention!
Well, this has been happening over the past year… and it may be reaching a tipping point.
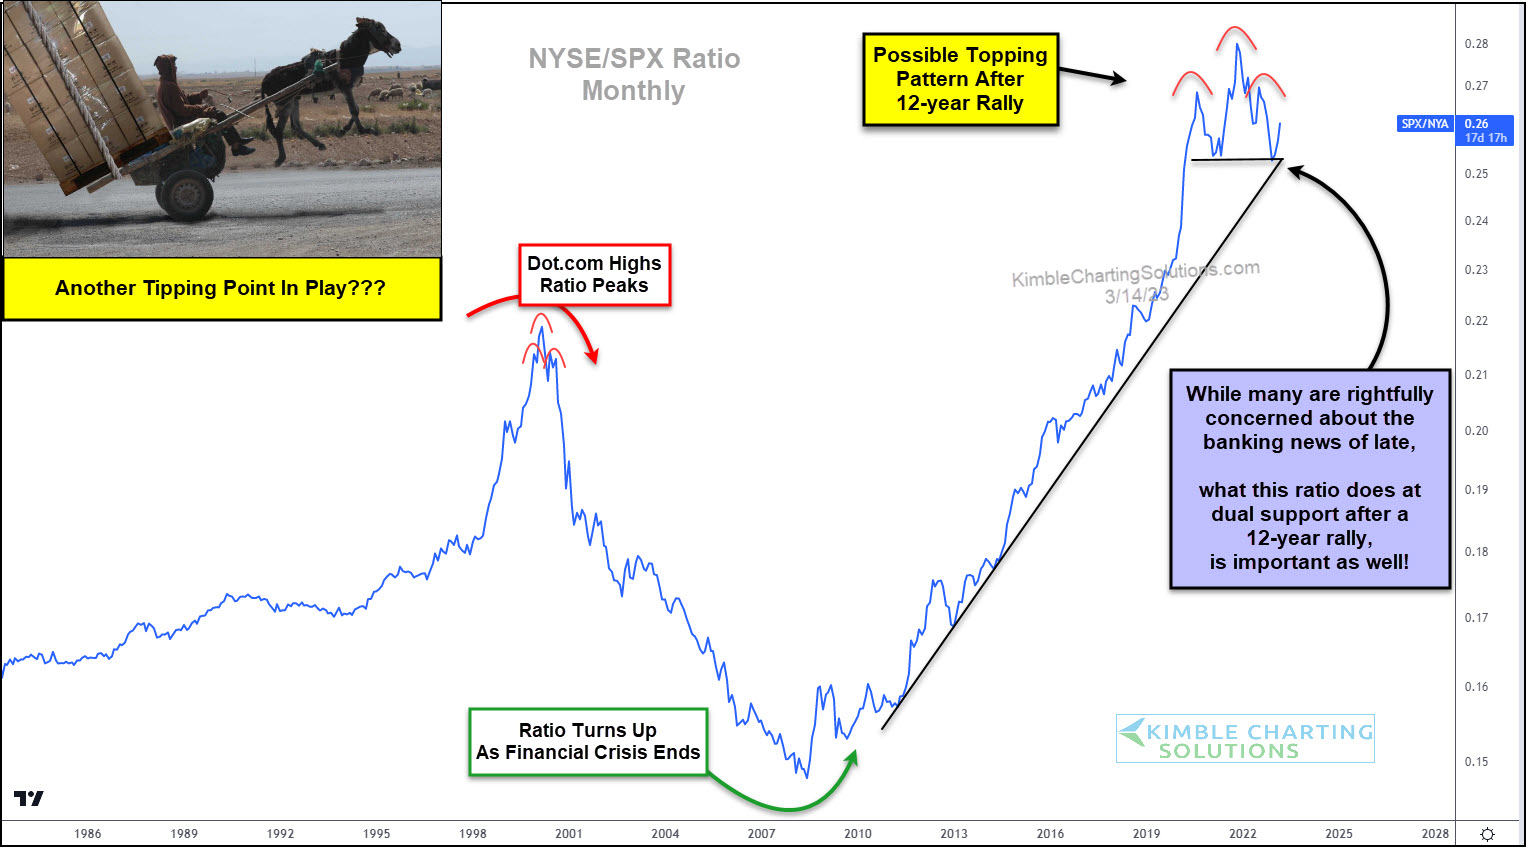
Below is a long-term ratio performance chart of the New York Stock Exchange to the S&P 500 Index. You can see how the NYSE has turned lower of late in a topping-like formation.
More importantly, we ask if this topping formation could be a head and shoulders pattern? The last head and shoulders pattern of consequence appears at the Dot.com highs. Yikes!
Currently, this pattern bounced off of 12-year uptrend support. But with the banking news of late, this ratio is still trading on thin ice.
If this thing tips over at this support level, it would send an important cautionary message to the broader market.
(Click on image to enlarge)
More By This Author:
Gold Bulls Eyeing Historic Super-Cycle Breakout Level
2-Year Yields Suggesting Another Financial Crisis Could Start Here?
Commodities Bearish Pattern Suggesting Lower Inflation?


Comments
Log in or sign up to join the conversation.