
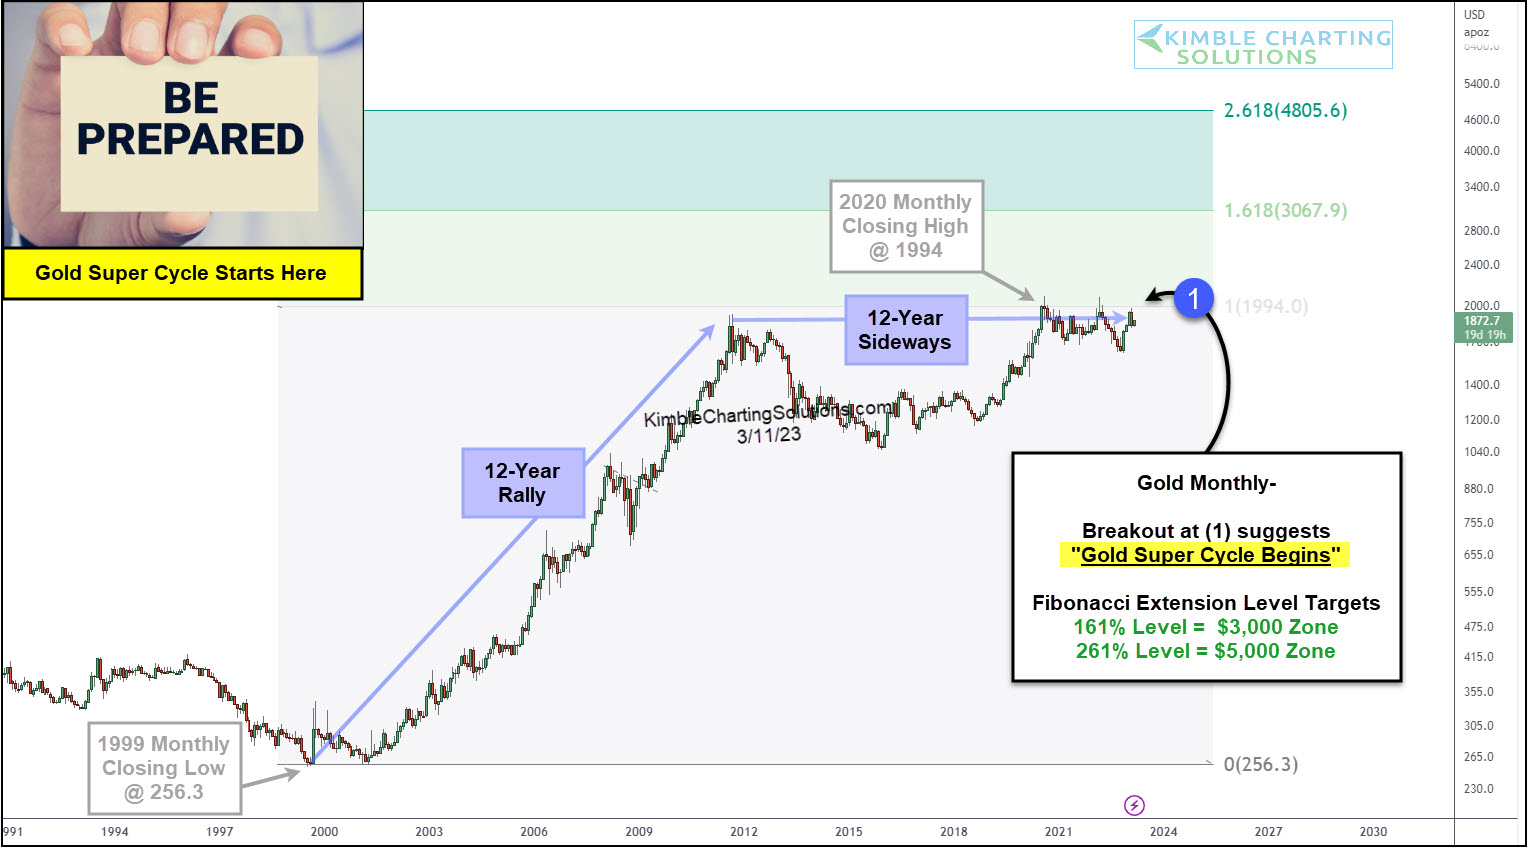
Nearly 12 years ago on 9/1/2011, I pointed to “the power of the pattern” and suggested that Gold should be flat to down for years to come.
And, if you look at the chart below, you can see that this unfolded as expected.
Fast forward to today (12 years later), and Gold is trading around $50 higher… and nearing a potential change in character once again.
Looking at today’s long-term “monthly” chart of Gold, I am of the opinion that the stage is being set for a new Gold Super-Cycle to start. 12 years higher, followed by 12 years sideways, followed by…
So, where does it start? On a breakout above resistance at (1).
Should this occur, we have a 161% Fibonacci extension target near $3000 and a 261% extension near $5000.
Probably a good idea to keep an eye on this breakout level.
(Click on image to enlarge)
More By This Author:
2-Year Yields Suggesting Another Financial Crisis Could Start Here?
Commodities Bearish Pattern Suggesting Lower Inflation?
Will Historic Bearish Reversals Spell Doom For Dow Transportation Average?


Comments
Log in or sign up to join the conversation.