S&P U.S. Indices Mid-Year 2023: Analyzing Relative Returns To CRSP
Following a challenging 2022, H1 2023 hosted a recovery among U.S. equities: the S&P 500® (up 16.9%) posted its fourth-best first half since 1996, and there were gains across the market cap spectrum. But on a relative basis, and in contrast to longer horizons, the S&P Core U.S. Equity Indices lagged their CRSP counterparts in H1 2023 (see Exhibit 1).
(Click on image to enlarge)

The informed reader knows that 2023 has been a strong year for mega caps and Information Technology companies. Indeed, the S&P 500 Information Technology (42.8%) and S&P 500 Top 50 (27.6%) posted their best first-half performance since 1996 (see Exhibit 2). Given that S&P DJI’s indices benefited from having less exposure to Information Technology in 2022, one might expect this helped to explain relative performance in H1 2023.
(Click on image to enlarge)

Exhibit 3 demonstrates that the S&P 500’s relative performance in H1 2023 was hindered by its lower weight in Information Technology. The Brinson attribution results show that less exposure to the Information Technology sector contributed negatively to the S&P 500 (-0.6%). Combined with the negative selection effect in Information Technology (-0.6%)—the S&P 500 and the CRSP US Mega Cap Index (as represented by the Vanguard Mega Cap Index Fund as a proxy) have different constituents owing to differences in index construction—likely around 50% of the S&P 500’s underperformance was attributed to Information Technology.
(Click on image to enlarge)

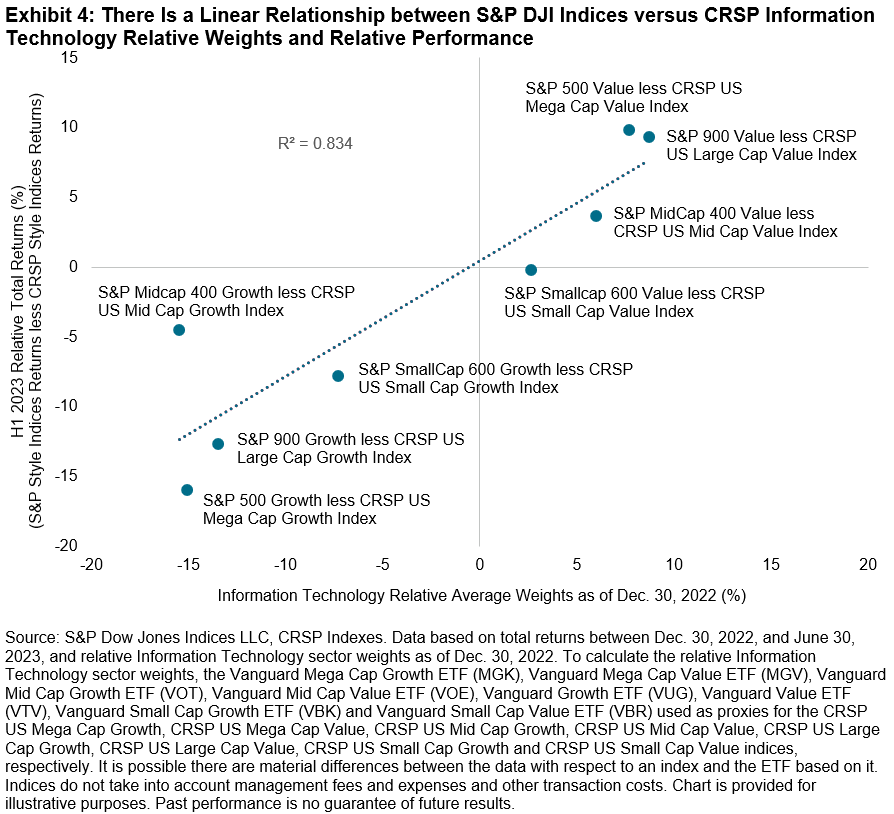
The consequences of Information Technology weight were even more apparent across style indices: Exhibit 4 shows that S&P Style Indices with more (less) exposure to Information Technology out- (under-) performed their CRSP counterparts in H1 2023. For example, the S&P 500 Value and S&P 900 Value posted their best relative H1 returns over the last 10 years, beating their CRSP counterparts by 9.9% and 9.3%, respectively. Conversely, the S&P 500 Growth and S&P 900 Growth posted their worst relative H1 returns over the same period, lagging their CRSP counterparts by 15.9% and 12.6%, respectively. Various CRSP index-based ETFs are used as proxies for the CRSP indices below.
(Click on image to enlarge)

The first half of 2023 once again highlighted the importance of index construction when assessing index characteristics, given different exposures can help to explain performance differences between indices with similar sounding objectives.
More By This Author:
The Case For TimberS&P U.S. Indices H1 2023: Analyzing Relative Returns To Russell
Getting To Know The Dow Jones U.S. Select Insurance Index
Disclaimer: See the full disclaimer for S&P Dow Jones Indices here.


