
S&P 500 Sector Performance Numbers
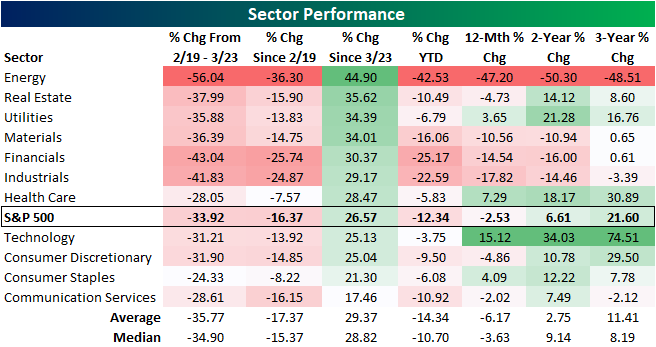
Below is an updated look at the performance of the S&P 500 and its eleven sectors over various time periods. From the S&P 500’s last all-time high on February 19th, no sector has been hit as hard as Energy. From those highs for the broader index, the sector had been more than cut in half by the time the S&P 500 found a bottom on March 23rd.In the time since then, Energy has been the best performing sector having risen 44.9%. Meanwhile, some of the best performing sectors over the past few years like Technology and Consumer Discretionary have performed essentially inline with the S&P during this rally. Despite Energy’s outperformance off the 3/23 lows, the sector is still down 36.3% since the S&P 500’s February 19th high and is down even more YTD. Over the past year, two-year, and three-year period, Energy has also been roughly cut in half.
After the huge rally we’ve seen since March 23rd, there are now four sectors that are back up on a year-over-year basis — Utilities, Health Care, Technology, and Consumer Staples. On a two-year basis, seven of eleven sectors are now back in the green, while only three sectors are now down on a three-year basis (Energy, Industrials, and Communication Services).
The S&P 500 as a whole is now down just 2.53% year-over-year, while it’s up 6.6% over the last two years and up 21.6% over the last three years.
(Click on image to enlarge)
The COVID crash brought most sectors to some form of a multi-year low. But with the significant bounce since 3/23 across sectors, a significant mean reversion has taken place and several sectors are now sitting more in the middle of the past few year’s range as shown in the charts below. Meanwhile, others like Energy, Financials, Industrials, and Materials remain at the lower end of those ranges.
Even on shorter time frame equity are simply in the middle of their ranges. Last week, the Health Care sector finally crossed back above its 50-DMA; the first sector to do so since the Utilities sector in the first week of March. Today, the Consumer Discretionary, Consumer Staples, Health Care, Materials, and Technology sectors have all done the same but are still within 1% of their 50-DMAs except for Health Care which is 2.5% above.
The S&P 500, Communication Services, Real Estate, and Utilities are only around 2.5 or fewer percentage points away from their 50-DMAs.But for Financials and Industrials, they are still over 8% away. Energy still has the furthest to go currently 13.5% below its 50-DMA.
(Click on image to enlarge)

Disclaimer: To begin receiving both our technical and fundamental analysis of the natural gas market on a daily basis, and view our various models breaking down weather by natural gas demand ...
more

