S&P 500: New Highs, Yes. But Weaker Internals Suggest Caution
Image Source: Unsplash
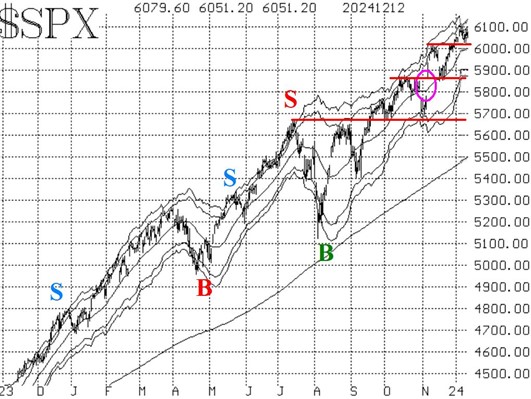
The broad stock market, as measured by indices such as the S&P 500, continues to probe new all-time highs. Last week, there was a positive catalyst in the form of the CPI number, which was benign enough to raise hopes for a further rate cut by the Fed. There is support at 6,010, with much stronger support at 5,870.
As long as SPX remains above 5,870, we will maintain a "core" bullish position. That number may have to be raised eventually, but that's where the strong support is now.

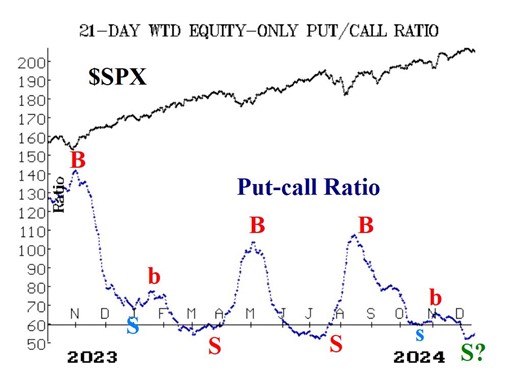
Equity-only put-call ratios just plunged to 2024 lows, but have begun to curl upwards over the past couple of days. This is one of the internal indicators that is beginning to show some weakness, even though SPX is trading near all-time highs.
At this point, I have marked this curl upward as a questionable sell signal ("S?" on the chart), because it's possible that this is yet another sideways move by the put-call ratio, such as we saw in October.

Breadth is another internal measurement that is not keeping pace with SPX. Breadth oscillator sell signals were confirmed in the past week, and this is our only confirmed sell signal at this time. On many recent days, breadth has been negative even while SPX is up on the day.
The VIX has continued to trade at low levels. The trend of a VIX buy signal remains in place. That buy signal will remain in place until VIX closes above its 200-day Moving Average for two consecutive days.
In summary, we continue to maintain a "core" bullish position. We will trade confirmed signals around that core, and we will roll deeply in-the-money options.
More By This Author:
Kohl’s: An Interesting, Speculative Play In The Retail Sector
TLTW: A High-Yield, Covered Call ETF With "Safe Haven" Appeal
Can The S&P 500 Notch Another 20%-Plus Gain In '25?
Disclosure: © 2024 MoneyShow.com, LLC. All Rights Reserved. Before using this site please read our complete Terms of Service, ...
more


