
S&P 500 Equalweight Lagging Badly
If you’ve been following the market over the last couple of months, you’ve likely noticed that the “mega-cap” stocks have been the main driver of the broad market’s move higher. You can really see this trend when looking at the performance disparity between the cap-weighted S&P 500 (SPY) and the equal-weight S&P 500 (RSP). (Just to be clear, the main S&P 500 index that’s tracked closely across the investment landscape is a cap-weighted index, meaning larger stocks have a bigger impact on its performance than smaller stocks. The lesser-followed equal-weight S&P 500 weights all 500 stocks in the index equally. In the equal-weight S&P 500, Apple (AAPL) — the largest stock in the index — and Unum Group (UNM) — the smallest stock in the index — have the exact same impact on the index’s performance.)
Yesterday was once again a bad day for most stocks as the equal-weight S&P 500 (RSP) fell more than 0.90% on the day. At the same time, the cap-weighted S&P 500 actually closed slightly higher on the day. As shown below, RSP has been stuck in a sideways pattern for the past two months, essentially going nowhere.SPY, on the other hand, has experienced a nice leg higher and is now very extended above its 50-day moving average. Over the last 12 trading days, SPY has closed at a new high 8 times while RSP has averaged a daily move of -0.02%. While the mega-cap growth stocks spent the time from late 2020 through early 2021 in consolidation, it’s not the smaller cap stocks in the index that look to have fallen asleep.

While RSP has been trading sideways for the past couple of months, it’s actually still slightly ahead of SPY on a year-to-date basis.

As shown below, RSP’s YTD lead over SPY has been declining rapidly since peaking in May/June, however.

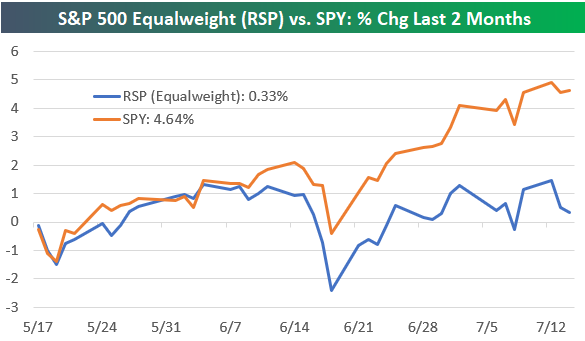
It’s the last two months that have caused RSP to give up nearly all of its 2021 outperformance versus SPY. As shown below, RSP is only up 0.33% over the last two months, while SPY is up 4.64%.
The recent underperformance we’ve seen from RSP is definitely outside the norm. Below we show the rolling 2-month performance spread between RSP and SPY since RSP began trading in 2003. There have only been two other periods where we’ve seen the 2-month performance spread turn more negative for the equal-weight S&P versus the cap-weighted S&P.The first was in late October/November 2008 when the entire market was falling rapidly during the Financial Crisis. The second was in late March 2020 during the COVID Crash. These two examples show that we normally see RSP significantly underperform SPY like this when the broad market is falling; not when it’s rallying to record highs on a seemingly daily basis.

Click here to view Bespoke’s premium membership options and sign up for a trial to any one of ...
more

