
S&P 500 Earnings Update & Economic Data Review - Saturday, April 17
S&P 500 Earnings Update

The earnings per share (EPS) for all S&P 500 companies combined increased to $184.05 this week, a gain of 0.4% for the week and +15.8% year-to-date.
8.8% of S&P 500 companies have reported Q1 results so far. 84% of those companies have beaten estimates, and results have come in a combined 30.8% above estimates. So far, Q1 earnings growth is +31%.

The S&P 500 increased +1.37% for the week, and is now +11.4% year-to-date – not including dividends.
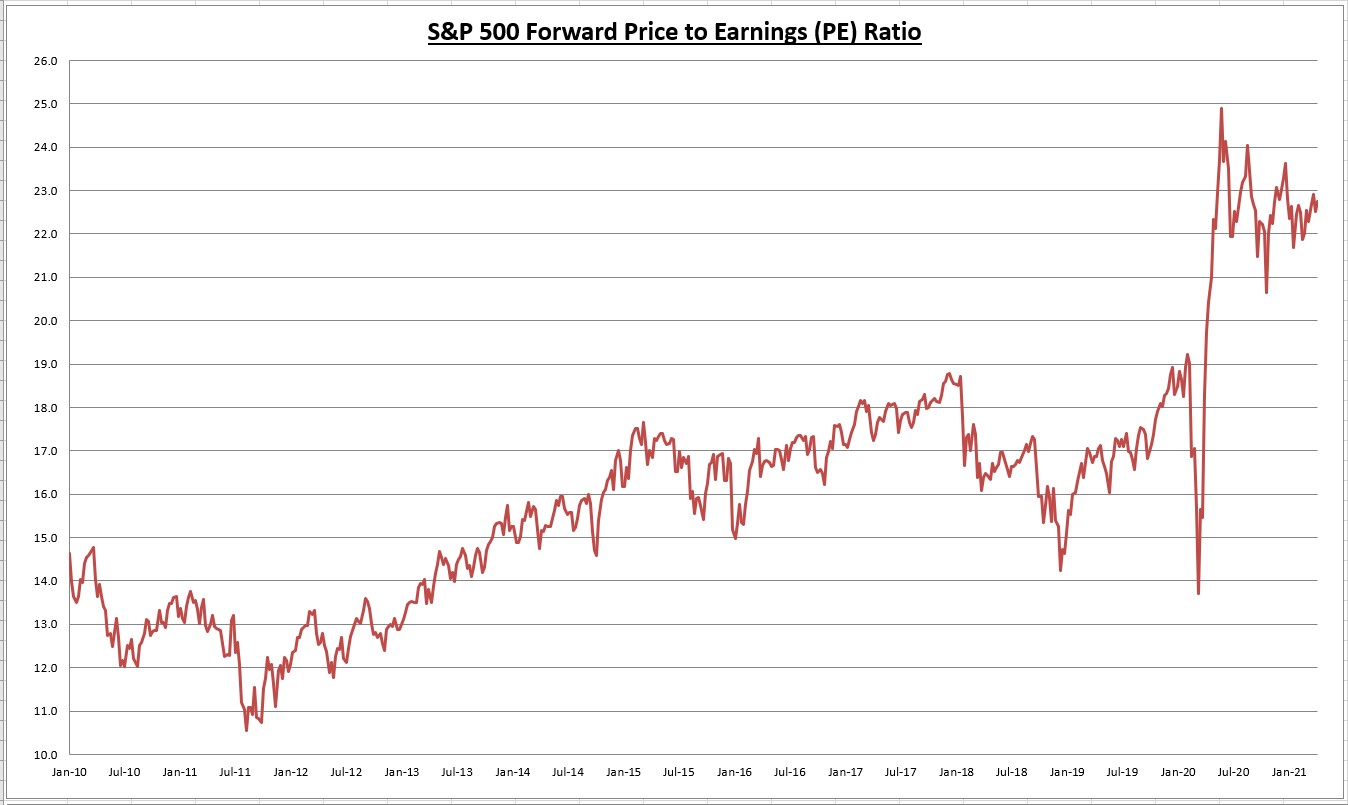
The increase in the index (+1.37%) was greater than the increase in the EPS (+0.4%). Therefore the market got a little more expensive, as the price to earnings (PE) ratio increased to 22.7x. Investors are paying $22.70 for every $1 in S&P 500 earnings.

The S&P 500 earnings yield is currently 4.4%, compared to the 10-year treasury bond rate (which declined for the second straight week) at 1.57%. The equity risk premium (earnings yield minus treasury rate) increased to 2.82% this week. Despite another record high, stocks are still reasonably priced based on fixed income alternatives and earnings growth.
Economic Data Review

The NFIB small business optimism index for March came in at 98.2; an increase of 2.5% for the month, and 1.9% annualized. Seven of the ten index components came in stronger than last month, led by the percentage of owners expecting the economy to improve, as well as an expected increase in sales. The NFIB began reporting the data on a monthly basis in 1986, and the historical average for the index is now 98.4.
“Quality of labor” was cited as the single most important problem for small business owners (with taxes and regulations as close runner-ups). “Small business owners are competing with the pandemic and increased unemployment benefits that are keeping some workers out of the labor force. However, owners remain determined to hire workers and grow their business.”

The Consumer Price Index (CPI) increased 0.6% in March, the highest monthly increase since June 2009. The CPI is now +2.6% on an annual basis (up from +1.7% annualized last month). The biggest contributing factor was the large increase in gasoline and fuel oil costs.

The Consumer Price Index (CPI) minus food and energy (Core CPI) increased 0.3% in March. Core CPI is now +1.6% on an annual basis (up from +1.3% annualized last month). Core inflation readings are the Fed’s preferred method of monitoring inflation. Though inflation is moving higher, as expected, it is still short of the Fed’s goal of +2% annualized.

Total retail sales for March came in at $619 billion, an increase of +9.8% above last month (which was also revised higher), and another all-time high. Total retail sales are now +17% above the pre-COVID-19 highs and +50% above the April 2020 lows. The gains were broad-based across all industry sectors, with every industry reporting gains from the previous month.

Total retail sales are +27.7% higher than they were at this point last year. This is by far the highest annualized growth rate since the dataset began in 1993. These are stellar results no matter which way you look at it.

Industrial production increased +1.4% in March (+1.0% gain year-over-year), led by gains in construction and mining. For Q1, total industrial production increased +2.5% annualized. Industrial production has now recovered 80% of the pre-COVID-19 decline, but it is still 3.4% below February 2020 levels.
Notable Earnings

Taiwan Semiconductors (TSM) reported Q1-adjusted EPS of $0.95, which is slightly above expectations and 27% above Q1 2020 results.

Revenues grew 25.3% above Q1 2020 results, and 1.9% sequentially. Trailing twelve month (TTM) revenues are now $50.8 billion, a record high for the company. TSM guided Q2 revenue growth between 24% to 26.8%, and expects full year 2021 revenue growth of 20%.

Gross margins and operating margins improved from Q1 2020 results, coming in at 52.4% and 41.5%, respectively. Operating income grew 25.7% for the quarter, and trailing twelve month (TTM) operating income now stands at $20.4 billion, another record high.
The company announced capital expenditures (CAPEX) for 2021 will likely come in higher than expected, around $30 billion. As well, supply constraints may not go away until 2023. Also, seasonal decline in smartphone related chip sales will partly offset strength in “high performance computing” chips.

If we look at the recent price pattern, we can see the current decline bottomed out at $107.89, which matches the -24% decline that occurred during the price consolidation of 2018-2019.

The stock bounced from $107 to $127, but is having trouble staying above its 50-day moving average. The company raised forward revenue guidance, but increased guidance on expenses by an even greater amount, which may be a reason why the stock is exhibiting weakness. As long as price can’t retake the 50-day moving average, the downside momentum puts the prior low at $107 back in play.
If $107 fails to hold, then I’d expect price to drop in the vicinity of $100 (which would match the -29.5% decline in March 2020 and coincides with the 200-day moving average). I would be adding to my positions should that happen. I believe in the company for the long-term.
The rumored Samsung production problems may only serve to increase TSM’s already strong competitive advantages, at around 60% market share according to Gartner. That being said, the stock does carry additional risks associated with international investing (currency, political, etc.).
Chart(s) of the Week

There were some good signs on the labor front. In the NFIB small business optimism report this week, 22% of firms said they plan on increasing employment in the next three months, and 42% of owners reported job openings they were unable to fill (a record high). The chart above shows that the total job openings from the JOLTS report last week is only 2.7% below all-time highs.
Despite being down more than 8 million net jobs below the pre-COVID-19 highs, the jobs recovery looks like it is going to gain momentum in the coming months. It is interesting to hear in the NFIB report that government stimulus programs are actually creating an incentive not to return to work in some cases.

During the pandemic, banks had to set aside hundreds of billions in loan loss reserves in anticipation of defaults. This was a direct hit to earnings. Earnings for the entire financial sector fell -38% in Q1 2020, and -47% in Q2 2020.

This week, many of the largest banks reported Q1 results that showed significant earnings growth. Much of this had to do with the release of those loan loss reserves that were added back to earnings. Total corporate profits for the financial sector could hit an all-time high this quarter.
Why is this important? The Fed suspended financial companies from buying back shares and dividend distributions were capped as well. Now that fears are subsiding, we should expect a gradual reversal of those restrictions. Even if you don’t own these individual bank stocks directly, chances are that you are indirectly invested via mutual funds/ETF’s. Financials make up about 15% of the S&P 500 index and about 22% of the large-cap value index as well.
Summary
As the pandemic took hold, earnings projections were reduced dramatically. As a result, reported earnings have been beating expectations by record amounts over the last three quarters. At some point, the pendulum will swing too far in the other direction -- where earnings projections get too optimistic. But it doesn’t appear that threat is coming anytime soon, as the Q1 beat rate is currently above 80% so far.
Much time has been wasted trying to anticipate the Federal Reserve’s next move. Let me save you the time, the Fed will not be raising rates anytime soon. The Fed’s current dual mandate calls for a jobs recovery and price stability (inflation). We are still 8.4 million net jobs below the pre-COVID-19 highs, meaning even if the economy gained 1 million net jobs every month, we wouldn’t reach the pre-COVID-19 highs until next year.
The second part of the dual mandate calls for inflation averaging above 2% for some time. This month’s core CPI reading shows inflation still hasn’t reached above 2% yet.
What if inflation gets too high, while employment hasn’t fully recovered? Regular readers know I believe that’s a realistic possibility somewhere down the road. But still, let’s let it show up in the data first. No need to worry about something that may never occur.
Next week, the Q1 earnings season really gets going, with 82 S&P 500 companies reporting. I’ll be paying attention to Netflix (NFLX) on Tuesday, Lam Research (LRCX) on Wednesday, and DR Horton (DHI) on Thursday. For economic data we have the Conference Board’s leading economic indicators index on Thursday, and New Home sales on Friday.
I/B/E/S data is from Refinitiv.
Disclaimer: None.


