
S&P 500 Earnings Update & Economic Data Review: Another EPS Increase
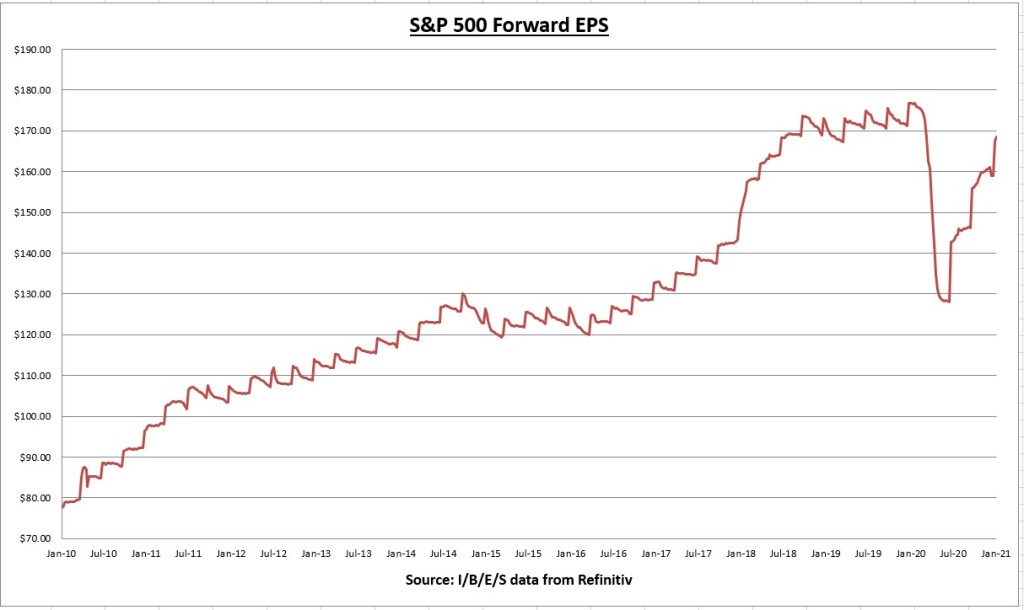
The earnings per share (EPS) for all S&P 500 companies combined increased again last week from $167.58 to $168.62. This is the highest EPS since March 13th, 2020.
About 5% of the S&P 500 have already reported Q4 earnings so far. Off to a great start, with 96% of companies beating estimates by a combined rate of 27.4%. (I/B/E/S data from Refinitiv)
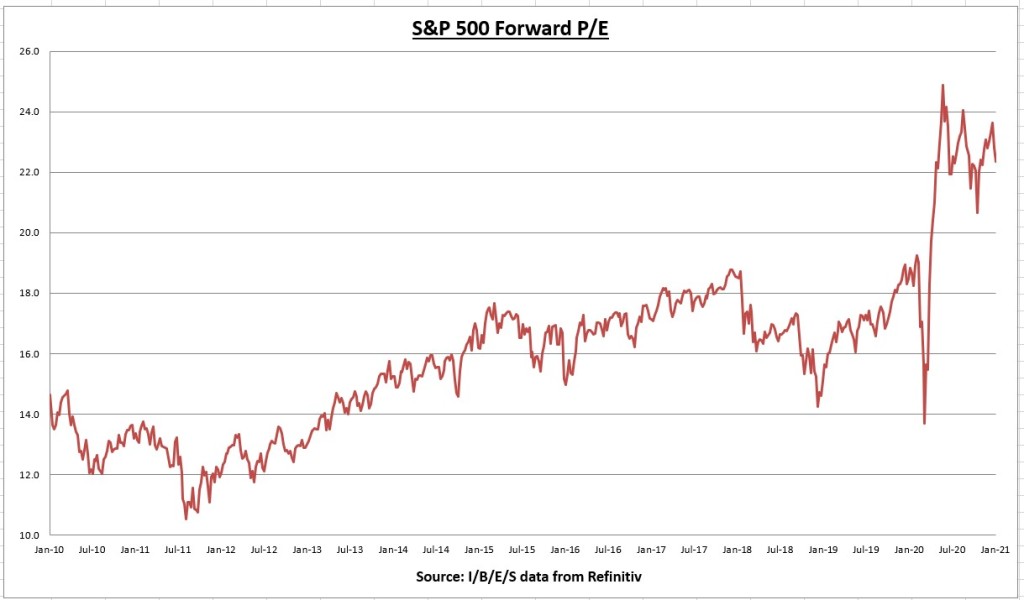
The S&P 500 index declined -1.48% last week. The increase in the EPS, along with the decline in price, pushes the price to earnings (PE) ratio down to 22.3 from 22.8. Put another way, investors are currently paying $22.8 dollars for every $1 dollar in S&P 500 earnings.
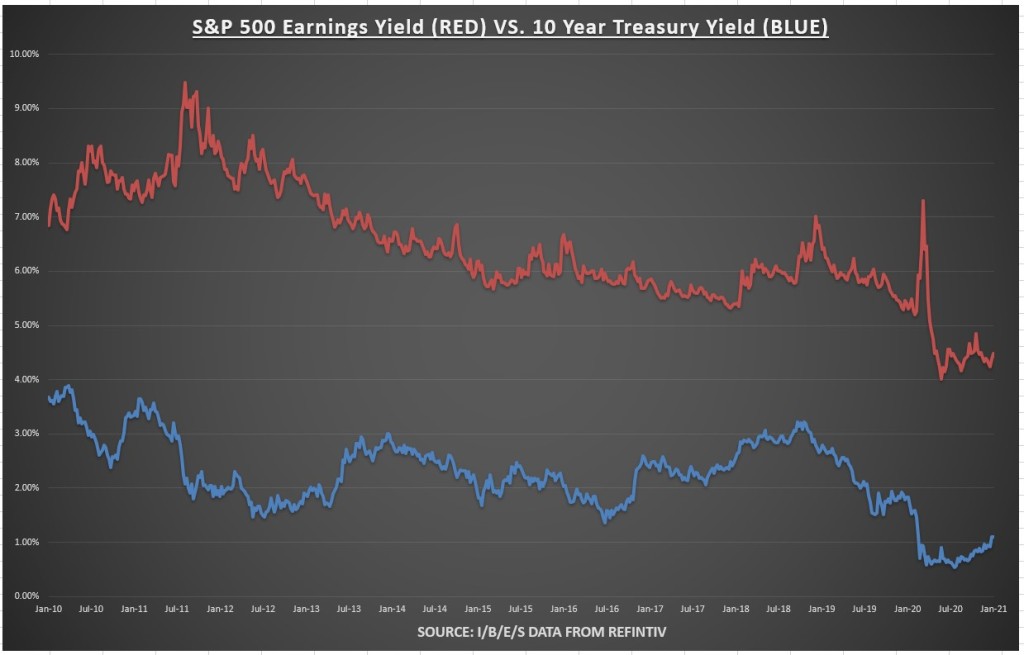
The earnings yield for the S&P 500 increased from 4.38% to 4.47%, while the 10-year Treasury bond rate declined from 1.105% to 1.097%.
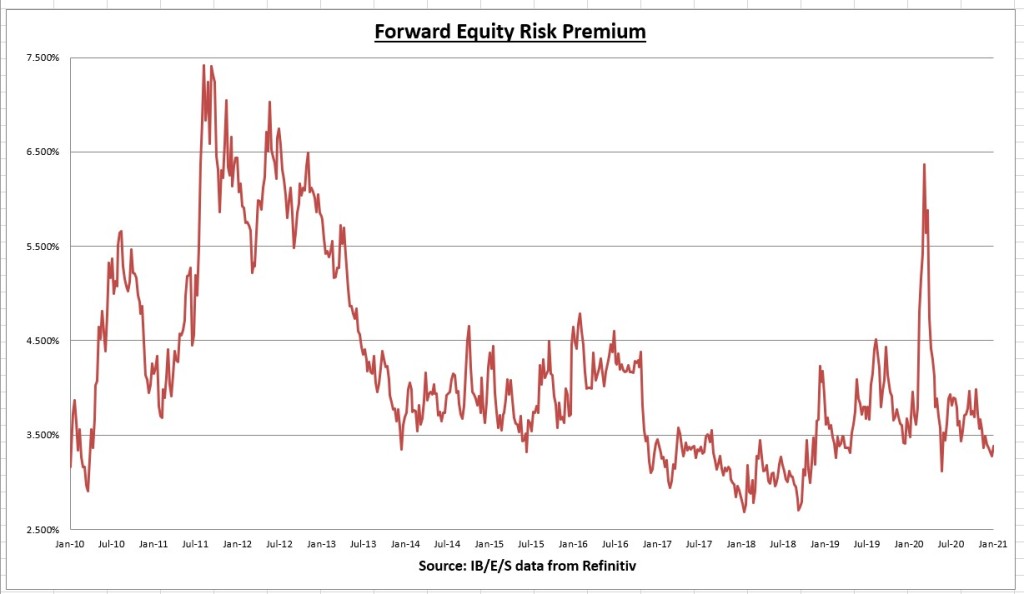
The equity risk premium increased from 3.277% to 3.378%. So although the PE ratio is above the historical average (stocks expensive), when adjusted for interest rates, the equity risk premium is more attractive than it was in 2010, when the S&P 500 was trading around 1,100.
Weekly Economic Data Review

The NFIB Small Business Optimism Index for December missed expectations by a wide margin, showing a steep decline from 101.4 to 95.9. I’m always on the lookout for silver linings, but there’s nothing to like about this report. Small businesses employ roughly 50% of the nations workforce, so these sentiment readings are an important barometer for future economic conditions.
Per the NFIB: “Concern about economic policy in the new administration and the increased spread of Covid-19 that is leading to renewed government-mandated business closures have owners pessimistic about future conditions over the first half of 2021”.
9 out of the 10 components within the report declined for the month. The two sub-indexes showing the biggest declines were:
1.) Percentage of owners expecting better business conditions over the next 6 months (this was one of the steepest monthly declines since 1986 and typically associated with recessions)
2) Sales expectations over the next 3 months
These are arguably the two most important components of the report. Per the NFIB: “The decline in expected business conditions and expected real sales accounted for two-thirds of the Index decline and will impact owner decisions about hiring, inventory investment, and capital spending.”
We are in a unique situation where it's difficult to quantify how much of this is transitory. The market is giving this a pass for now, but if these numbers don’t materially change in the next few months I would expect the market to not be as forgiving.
Which leads me to the runoff election results. The Senate composition now consists of 50/50 Democrat/Republican with the VP being the tiebreaker. It’s still too early to draw any conclusions. The slimmest majority means much of the agenda is likely off the table for now. But they don’t need 60 votes to increase taxes. I see this as a net negative for the economy, but not anything to materially change the outlook. Higher corporate tax rates reduce profit margins and fiscal stimulus increases inflation expectations, which increase interest rates, which would reduce the equity risk premium.
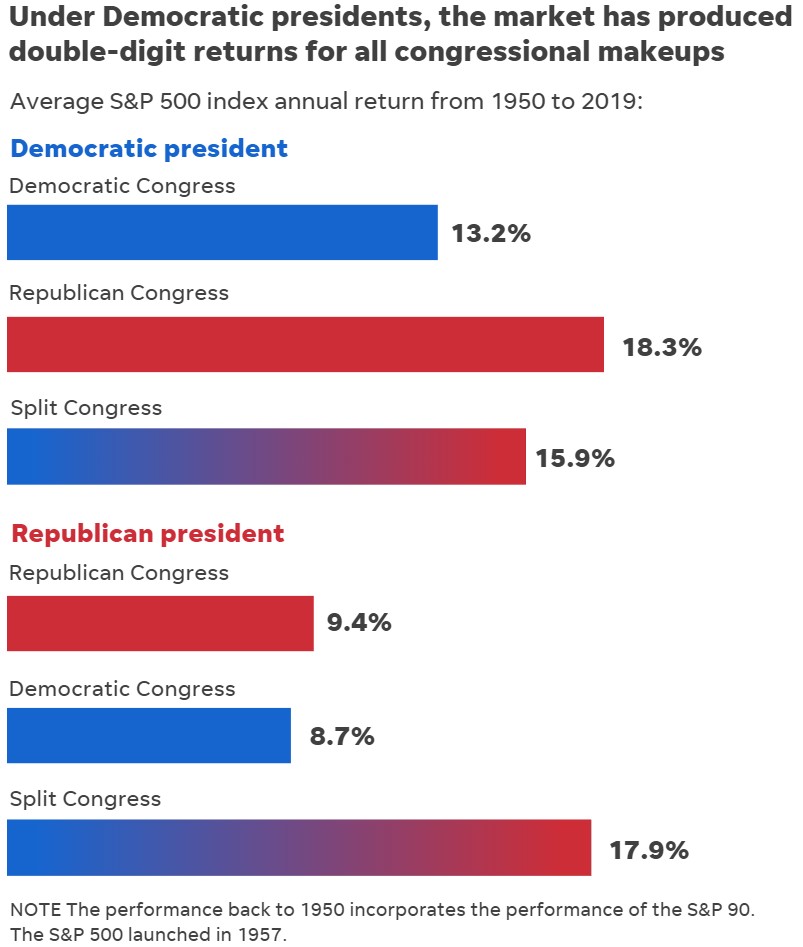
Despite the rhetoric, historical returns show a Democratic president and democratic congress have produced a 13.2% annual rate of return for stocks. Ironically, this is better than the Republican president and Republican Congress configuration. This doesn’t mean we’re all going to get 13% annual returns for the next four years either. I’m simply saying don’t let any election results drive your investment decisions. Good companies will adapt to the situation and life will go on.

And here’s an even more contrarian opinion, the above chart shows that stocks actually have a history of going up in years that taxes are raised. To put things in perspective, corporate tax rates will probably rise from 21% to 28%, but still below the 35% that was in place for much of this generation (without a recession). I wouldn’t make any investment decisions based upon tax law changes.

Decembers inflation reading via the consumer price index (CPI) came in as expected. Core CPI year over year declined from 1.65% in November, to 1.61% in December. No issues here.
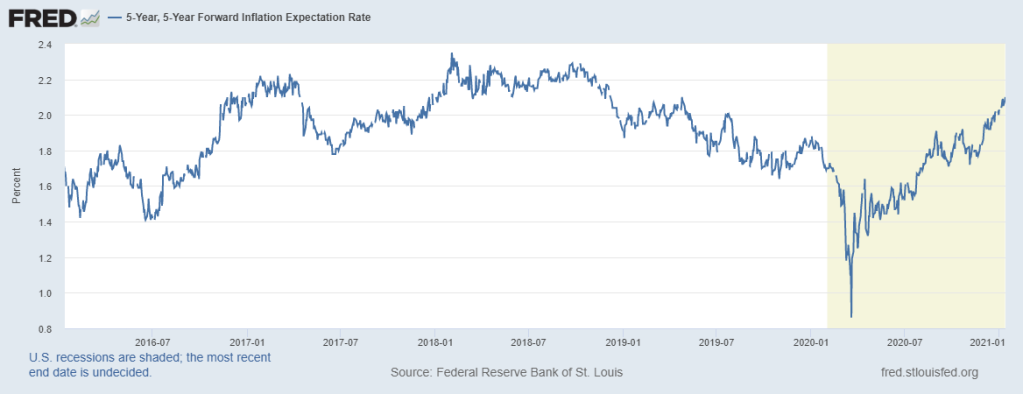
Although inflation expectations have been increasing for a while. I suspect this will be more of a second half of the 2021 story.
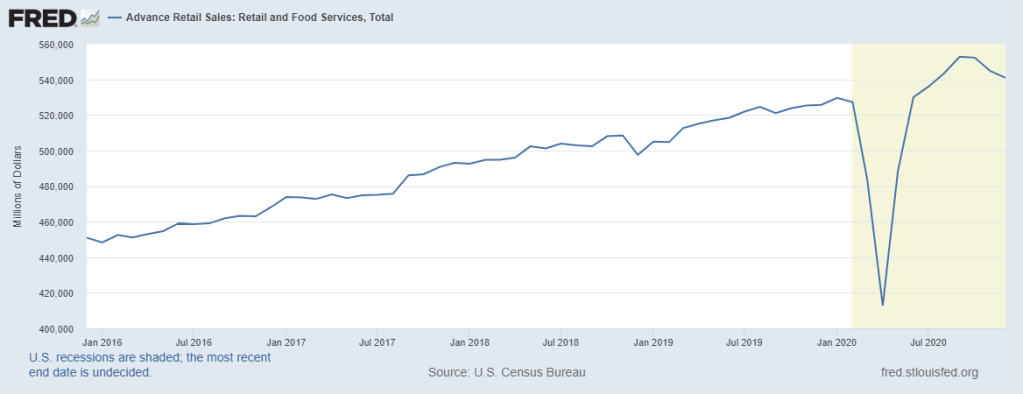
December total retail sales declined -0.7%. This marks the 3rd straight monthly decline, which correlates to the slowdown in the jobs recovery due to renewed COVID restrictions. Despite the recent weakness, total retail sales are still +2.9% higher than last year, +2.13% above pre-COVID highs, and +31.05% higher than the April 2020 low point.
Miscellaneous
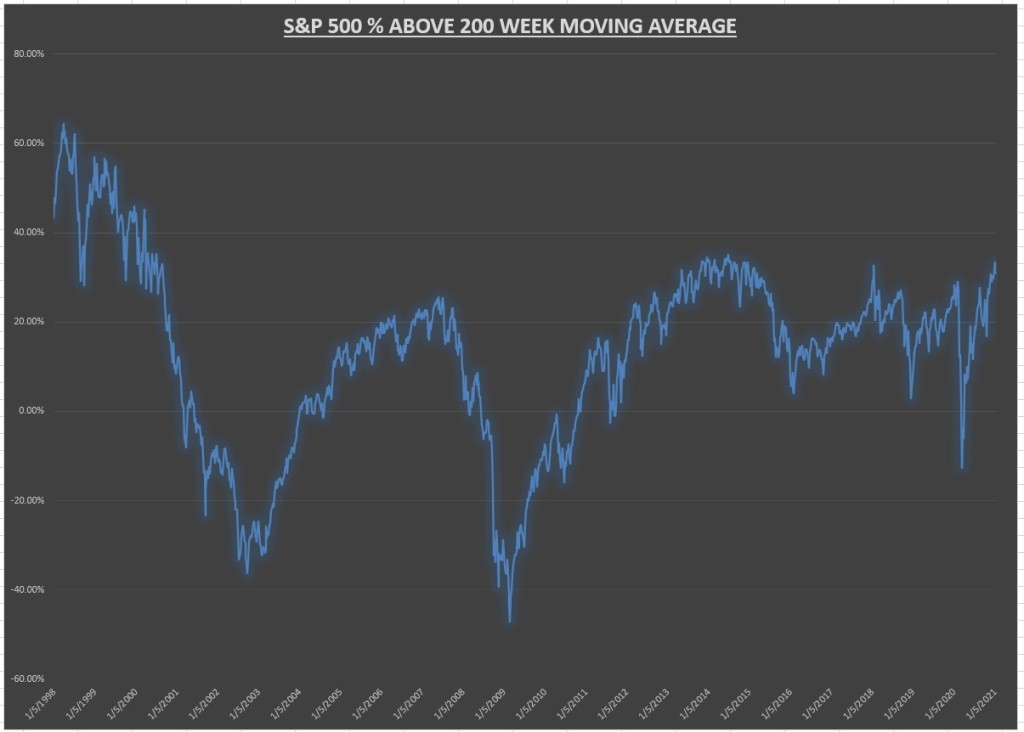
One of the many internal indicators I follow is where the S&P 500 index is trading relative to its 200-day and 200-week moving averages. These indicators may be pointing to an overbought condition in the short term. The above chart shows where the S&P 500 trades in comparison to its 200-week moving average. As of Friday’s close, the S&P 500 is about 30% above its 200-week moving average, which is approaching the highest level since the 2000 dot com bubble.

The S&P 500 is trading about 14% above its 200-day moving average, which is still at the upper end of the range over the last 23+ years.
I want to stress these indicators are more for the short term, and not really of use for long term investors. The fundamentals continue to be positive for stocks, but the market may be a bit stretched and vulnerable to a correction in the short term. Next week we’ll take a look at some of the market technical and internal readings since economic data will be light.
Summary: In my guesstimation, I’m looking for a minor slowdown in Q1, a pickup in Q2 as fiscal stimulus starts kicking in, and then a sizeable rebound in Q3 and Q4 assuming the vaccination efforts go as planned. After that, I expect us to regress back to the slow-growth economy that we’ve had for much of the last decade. Economic policies of the new administration are probably not going to help the economy grow, but it's unlikely to push it off a cliff either IMO.
The earnings recovery is still well in place, and rates are still low enough to keep valuations reasonable (even though the PE is high). Stocks have had a solid run-up off the March 2020 lows and maybe overbought in the short term. Don’t be surprised if we get a correction in the near term. Get your shopping list ready in advance, just in case!
Economic data will be light, but the heart of the Q4 earnings season will get underway in the next couple of weeks. It will be interesting to see, A) how companies report earnings against current expectations and B) how they report forward-looking guidance (if they even give guidance at all). This will probably determine the near term market direction.
Disclaimer: None.


