
Small-caps have awoken from their slumber. The Russell 2000 is up 6.6 percent in the last three sessions, with a breakout at 2100. Long a laggard versus large-caps, particularly tech, small-caps’ latest outperformance is raising questions as to if this is a one-hit wonder or the beginning of a sustained rotation from tech.
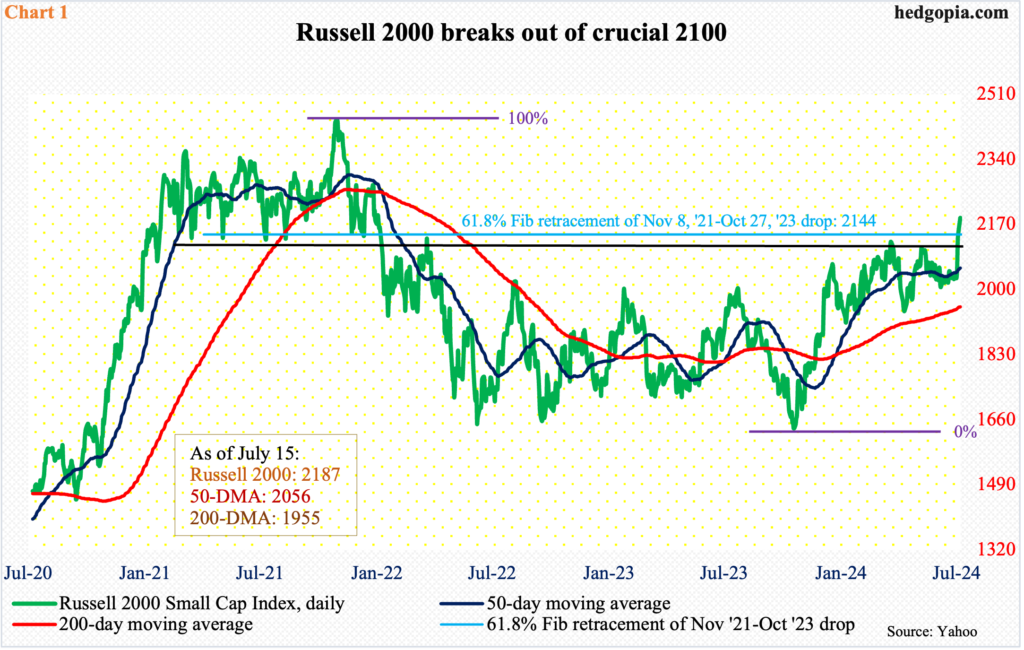
Small-caps have spring in their step. For the third session in a row through Monday, money has moved into small-caps, with the Russell 2000 jumping 6.6 percent during the period, breaking out of 2100.
In November 2021, both the Russell 2000 and Nasdaq 100 peaked before beginning a sustained move lower. Peaking at 2459, the small cap index subsequently bottomed at 1641 in June 2022, which was successfully tested in October of both 2022 and 2023. A 61.8-percent Fibonacci retracement of that drop lies at 2144 (Chart 1); 2100 also provided support for a year before it was lost in January 2022. The index then went back and forth between 1900 and 1700 for nearly two years before breaking out last December; 2100 thus represents a measured-move price target post-breakout.
Last Thursday, June’s consumer price index was published, and the report confirmed the prevailing disinflation trend, giving a jolt to rate-cut bets. As things stand, futures traders are betting on up to three 25-basis-point cuts this year, beginning in September. Small-caps were bid up, resulting in gap-ups both Thursday and Friday. Momentum continued Monday, ending at 2187.
Traditionally, small-cap performance has been treated as a window into the state of the economy, getting bid up as investor optimism surrounding the economy grows. That is not the case here. The US economy continues to perform well despite the 525-basis-point tightening in the fed funds rate between March 2022 and July 2023. If anything, things might decelerate from here, and there are signs this is occurring.
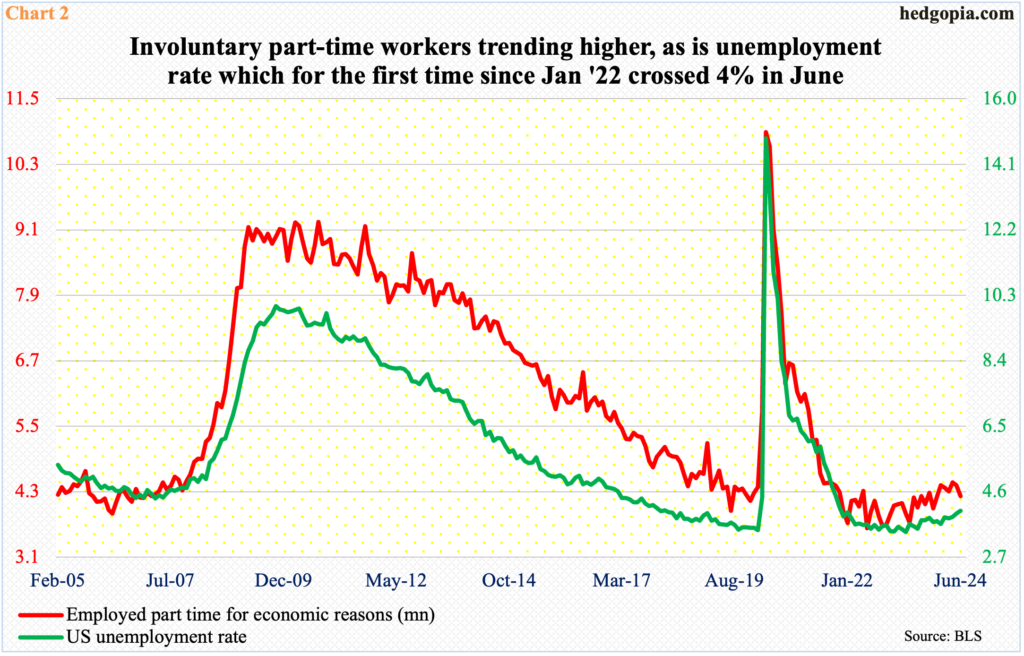
In June, the US unemployment rate rose to 4.05 percent. This was the first time since January 2022 it crossed four percent (Chart 2). The unemployment rate has been gradually trending higher since hitting 3.43 percent in April 2023. Concurrently, involuntary part-time workers bottomed at 3.63 million in June 2022; two years later, this reached 4.22 million.
What is probably driving the small-cap rally is hope for a rotation from tech, with the latter having gone gangbusters since bottoming last October, or even October 2022. Unlike the Russell 2000 that remains well under its November 2021 high, the Nasdaq 100 posted a new high last December and has not looked back since, rising to one after another record high.
The rotation trade comes with a risk. The Russell 2000 began to surge last week in hopes for lower interest rates. But the Federal Reserve is unlikely to begin a sustained cutting cycle. The economy just does not need one right now. If and when it does, and the central bank meaningfully lowers rates, this would have taken place only if the economy meaningfully decelerates. This will have earnings repercussions.
There is the rub!
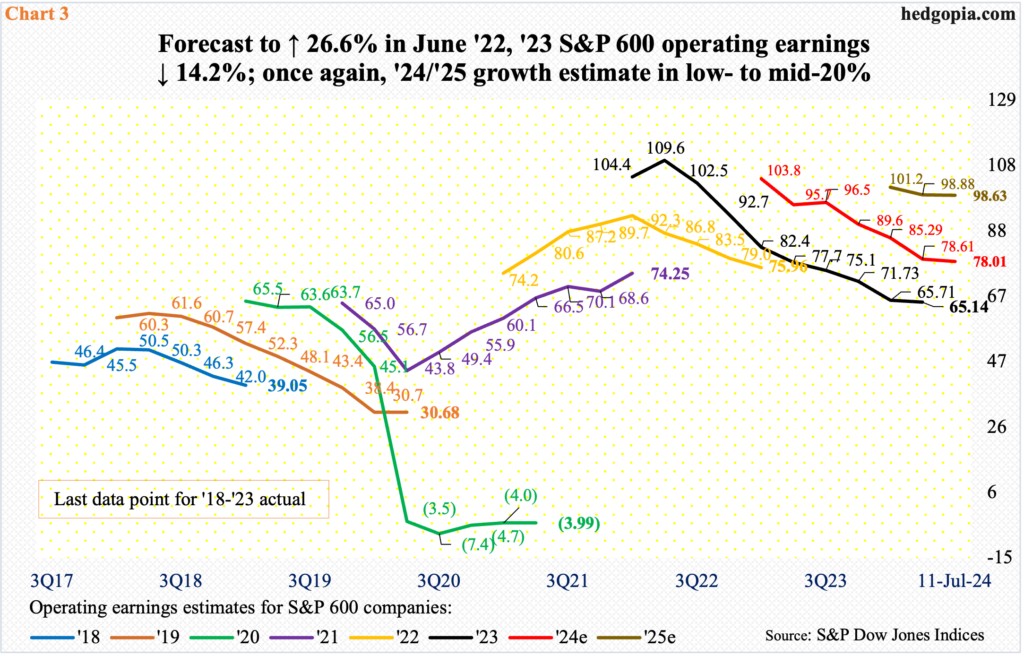
Operating earnings estimates for S&P 600 companies for this year and next have been coming down but remain elevated. For 2024, the sell-side expected $105.68 in March last year. As of last Thursday, this stood at $78.01. Reality is also sinking in relating to next year’s consensus, which went from a high of $102.88 this May to $98.63 (Chart 3).
If the economy decelerates enough to warrant aggressive easing by the Fed, next year’s estimates are nothing but a pipe dream. Right now, 2025 earnings are expected to grow 26.4 percent, coming on the heels of this year’s expected 19.8 percent growth. For reference, 2023 earnings were expected to jump 26.6 percent in June 2022; when it was all said and done, earnings fell last year by 14.2 percent.
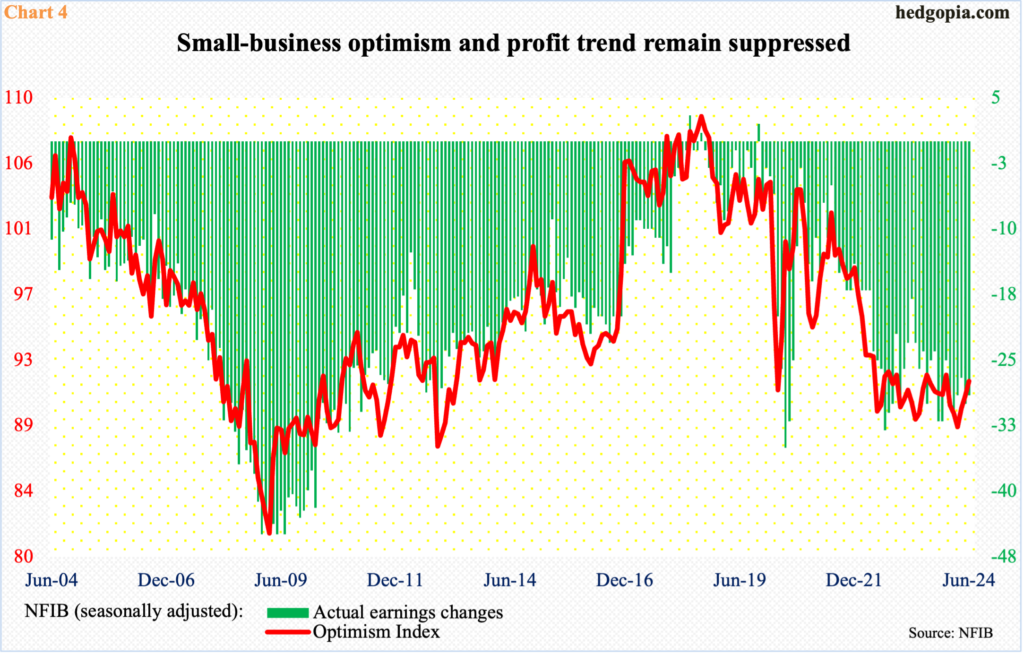
Rather revealingly, current small-business sentiment hardly argues for a meaningful pickup in earnings.
The NFIB Optimism Index was 91.5 in June – a six-month high. March’s 88.5 was the lowest since December 2012 (Chart 4). Sentiment remains suppressed.
Not surprisingly, the Actual Earnings Changes sub-index, which reflects the profit trend, reached a minus 29 in June – again, a grossly suppressed territory.
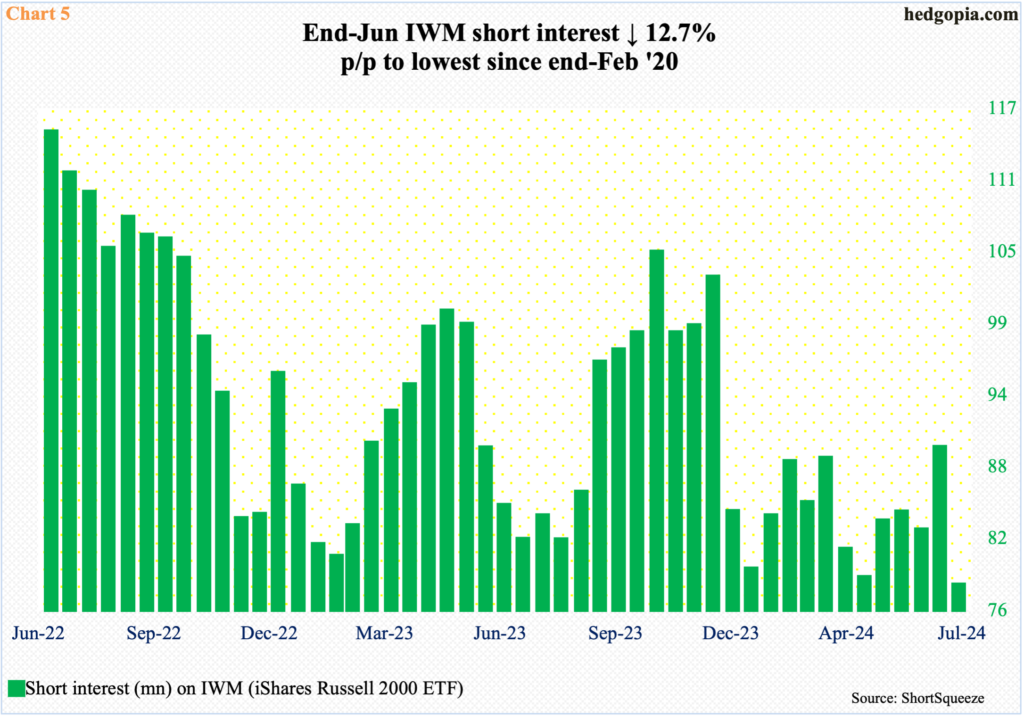
Amidst all this, at the end of June, short interest on IWM (iShares Russell 2000 ETF) declined 12.7 percent period-over-period to 77.7 million – the lowest since the end of February 2020 (Chart 5). This can be viewed in at least a couple of ways: (1) shorts left anticipating a forthcoming rally, and/or (2) lower odds of potential squeeze, hence tailwind for continued rally.
That said, in the futures market, non-commercials’ net shorts in Russell 2000 mini-index futures remain relatively high (more on this here). Holdings are as of last Tuesday. This week’s numbers will be telling, as this would have covered the massive rally in the cash last Thursday and Friday. A meaningful drop in the holdings would suggest the rally was helped by a squeeze.
Ideally, small-cap bulls should want to see the latest rally get treated with skepticism. They have the ball for now. It is probable 2100 gets retested sooner than later. If it is a genuine breakout, then there will – and should – be bids waiting at/near that level.
More By This Author:
What The CoT Is Saying About The Future Through Futures, How Hedge Funds Are PositionedEquity Bulls Dread 1st Rate Cut, As This Could Touch Off ‘Sell The News’ Phenomenon
Equity Bulls Running Riot, Sentiment Lopsidedly Bullish – Market Risk High


Comments
Log in or sign up to join the conversation.