
A few weeks ago, we wrote Economic Warning From The NFIB to share information from the latest NFIB small business survey. While the economy appears to be in good shape, the NFIB shows that smaller businesses, including some small-cap stocks, are suffering. Per the article: “the NFIB small business confidence survey declined in its latest reading. Not only did it fall to the lowest level in 11 years, but, as far as an economic warning goes, it remained at levels historically associated with a recessionary economy.”
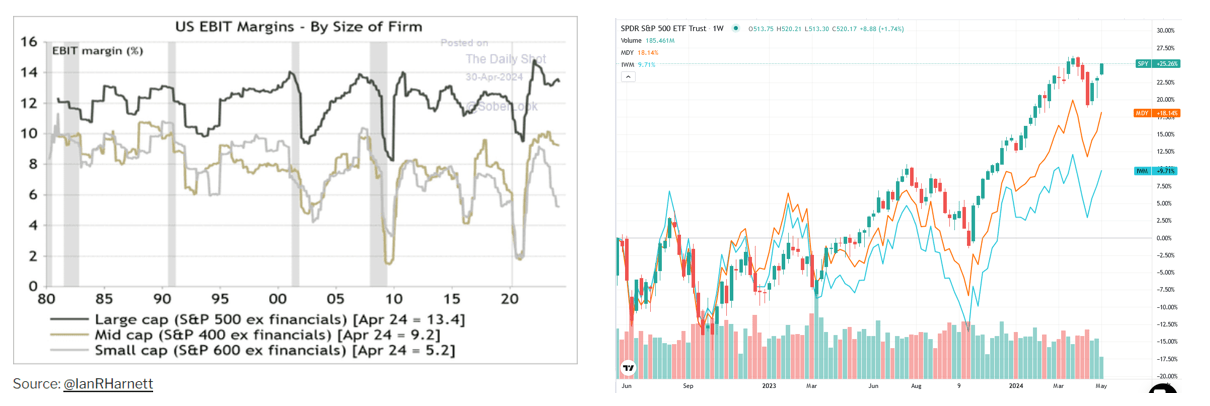
The graph below comparing EBIT (earnings before interest and taxes) profit margins of large, mid, and small-cap companies further highlights the problems facing small businesses. Large and mid-cap non-financial corporations have EBIT profit margins near recent highs. Conversely, profit margins for small-cap companies are at the lower end of their 45-year range. Also interesting is that in the aggregate, large-cap companies have profit margins that are 4% more than mid-cap. Mid-cap companies have profit margins that are about 4% greater than small-cap companies.
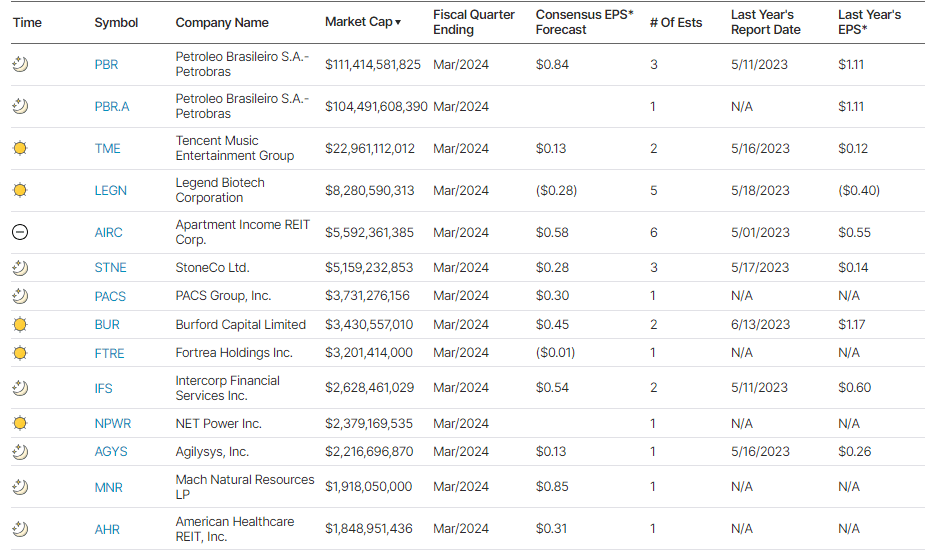
Two primary reasons explain the recent divergence in profit margins. First, small-cap stocks have less price power. Therefore, they are not as efficient at passing on higher prices to their customers. Second, larger companies have much easier access to credit. In 2020 and 2021, when rates were low, many of these companies refinanced their debt. It was not as easy for smaller companies to follow suit. The two-year performance chart comparing the large (SPY), mid (MDY), and small-cap (IWM) stocks is reflective of the profit margin differentials.
What To Watch Today
Earnings
Economy

Market Trading Update
Last week, we discussed whether the recent rally from the lows was just a sucker rally ahead of a more significant decline. Our assessment was that was likely not the case. To wit:
“The market surged higher on Thursday and Friday, supported by Apple’s massive $110 billion stock buyback program. With a MACD “buy signal” triggered on Friday and the market not overbought yet, a push above resistance at the 50-DMA seems likely next week. That break of resistance should allow the bulls an opportunity to retest 5200 over the next month or so.
However, while the bullish market setup is intact in the near term, we continue to expect another decline this summer before the election. Historically, institutional players are reticent about holding long exposures heading into an election, so we often see weakness in September and October.”
This past week, the market broke above the 50-DMA with a solid confirmation of the MACD “buy signal.” Currently, the market is decently overbought after the advance, so a pullback to retest the 50-DMA would be welcome. Such a pullback would turn the 50-DMA from previous resistance into support and reduce some overbought conditions.
Importantly, the breakout above key resistance and the reversal of the volatility index suggest that the recent correction is over. However, while the April correction may be over, as noted above, there is still a decent probability of another correction before the Presidential election in November. As shown below, such tends to be a statistical normality during Presidential election years.

Of course, that is just the “average.” This means that Presidential election years have been better and worse. As such, we must continue monitoring and reacting to the market as the macro and micro environments evolve.
The Week Ahead
Inflation week is upon us, with PPI on Tuesday and CPI on Wednesday. PPI is expected to show producer prices, often a leading indicator of CPI, rose 0.2% last month. CPI and CPI core are expected to increase by 0.3%, 0.1% below last month’s levels. As we have noted numerous times, the eventual catchup between market rental prices and those the BLS uses to compute CPI will result in lower inflation. Standard Charter echoes our thoughts. Per their article Will OER Bail Out The Fed:
Our regression analysis suggests that Powell’s optimism may be justified. It points to a sharp decline in OER in coming months based on a regression that has proved stable in recent years (Figure 1).

In addition to CPI, the market will also get the latest retail sales report. Wall Street economists think last month’s hot reading of 0.7% growth will moderate to +0.4%.
Chairman Powell will give a speech on Tuesday, further clarifying the Fed’s stance on inflation and the economy. He will likely have the CPI and retail sales data in hand when delivering the speech. Accordingly, the market will look for clues he may have on those two data releases.
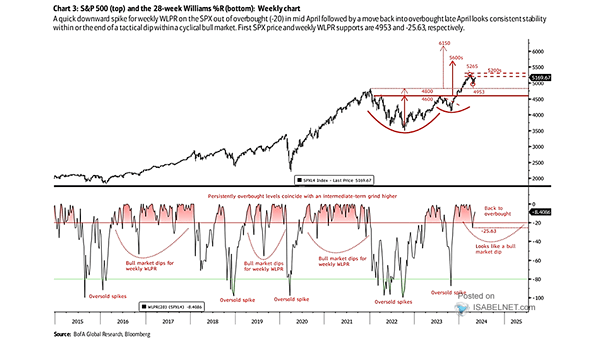
The Williams R% Convinces BofA Of More Upside
The graph below is courtesy of BofA and ISABELNET.com. Looking at the technical indicator Williams %R and the pattern that played out in 2022 and 2023, BofA believes the S&P 500 rally may have much more to go. The top graph plots the S&P 500, and the bottom shows the corresponding Williams %R for the last ten years. The Williams %R tends to stay in overbought territory during bull market runs with an occasional minor correction to fair value. Large market downdrafts spike the Williams %R to oversold territory. Based on the graph, BofA’s bullish case has the S&P 500 running to 5600 – 6350.
Their estimate is based on a cup-and-handle pattern that played out in 2022 and 2023. The recent decline looks like a minor correction to fair value on the Williams %R, in what they think will be a longer string of oversold readings on the indicator. If you believe their logic is valid, 4953 is critical support. A break of that level could invalidate their projection.
The Williams %R quantifies an asset’s daily closing level in relation to its highest and lowest prices over a specific period. For instance, a stock that closes at the high for the period would have a Williams %R of 0. Conversely, a stock settling equally between the high and low would record a score of -.50. For more information on the indicator, click HERE.
Caveat: The BofA analysis is based on one technical indicator and one technical pattern. There are literally hundreds available. Some are equally bullish, while others are more bearish. Do your own research and consider not only technical indicators and patterns but also fundamentals, the coming elections, and geopolitics when making investment decisions.
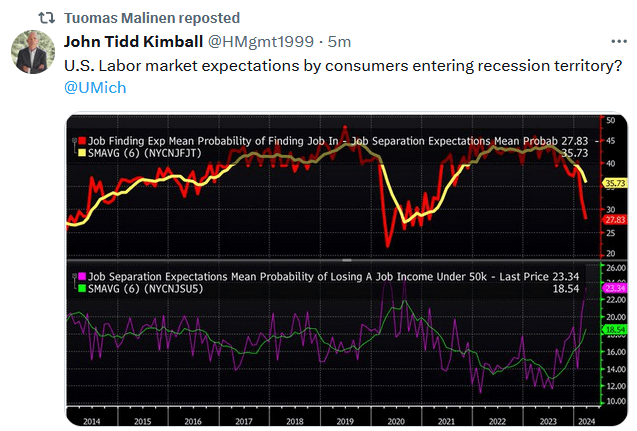
Tweet of the Day
More By This Author:
The Correction Is Over As Stocks Bounce BackStock Buybacks Are Growing Again
The Investment “Holy Grail” Doesn’t Exist


Comments
Log in or sign up to join the conversation.